NON-FERROUS ALLOYS: NICHROMES, T-D NICKELS AND NIMONICS
7.1 General Features of the Deformation of Nickel-Based Alloys
7.2 Origins of the data for Nickel-Based Alloys
UP TO this point we have considered only pure metals. Although such maps are instructive, they are rarely useful for engineering design: even the simplest alloys are more complicated. In the first place, important physical constants such as the diffusion coefficients and moduli are changed by alloying. And alloying introduces new microscopic processes which oppose dislocation motion: solution strengthening, precipitation hardening and dispersion hardening. Their influence on the rate equations was discussed in Chapter 2, and can be seen in the maps presented here.
It is impractical to give a complete treatment of the deformation of alloys. Instead we shall consider six alloys based on nickel: two nichromes, deriving their strength from a solid solution of chromium: a Ni-ThO2 alloy exemplifying dispersion hardening; two Ni-Cr-ThO2 alloys which combine solution and dispersion hardening; and MAR-M200, a nickel-based superalloy which combines solution, dispersion and precipitation hardening.
We have chosen these because they illustrate many of the effects of alloying, and are sufficiently well characterized that maps for them can be constructed. They are shown in Figs. 7.1, 7.2 and 7.4 to 7.9. The parameters used to compute them are listed in Table 7.1; those for pure nickel are included for comparison. Ferrous alloys are described in Chapter 8.
|
7.1 GENERAL FEATURES OF THE DEFORMATION OF NICKEL-BASED ALLOYS |
The various influences of alloying on deformation maps are best seen by comparing the maps of this chapter with those for pure nickel, of the same grain size, shown in Figs. 1.2 and 4.4.
A solid solution, illustrated by the nichromes (Figs. 7.1 and 7.2) raises the yield strength. The effect is masked by work-hardening in Fig. 1.2, but becomes clearer if Fig. 7.1 is compared with Fig. 4.4. The solute slows power-law creep throughout the field: the 10% nichrome creeps roughly 10 times more slowly than pure nickel, at a given stress and temperature; and the 20% nichrome creeps almost 3 times slower still. There is an influence on diffusional flow, too: the diffusion coefficients are changed (Fig. 7.3) and the solute can exert a drag on the grain boundary dislocations which are the sinks and sources of matter during diffusional flow. (This last effect is discussed further in Chapter 17, Section 17.3, but is not included here.) The relatively larger retardation of power-law creep causes the power-law creep field to shrink and that of diffusional flow to expand relative to pure nickel.
A dispersion also raises the yield strength. The maps for thoriated nickel and nichromes (Figs. 7.4, 7.5, 7.6 and 7.7) are for recrystallized material, and are properly compared with Fig. 4.4 for pure nickel. The yield strength is found to relate directly to the particle spacing l through the Orowan formula (Wilcox and Clauer, 1969) [1]:
|
|
The most striking difference, however, is the retardation of power-law creep, which is 10-2 to 10-3 times slower than in pure nickel at the same stress and temperature. Both the dispersion and the solid solution influence diffusional flow also (Chapter 17, Section 17.3) but to a lesser extent, so that the field of power-law creep shrinks dramatically.
Diffusional flow, too, is influenced by alloying (Chapter 17, Section 17.3). A solid solution reduces the mobility of the grain-boundary dislocations which are the sinks and sources of matter during diffusional flow, slowing the rate of creep and changing the stress dependence, particularly when the grain size is small. A fine dispersion of particles pins grain-boundary dislocations, creating a threshold stress τth below which they cannot move, and no creep is possible. The expected change in deformation map is illustrated by Fig. 7.5 for nickel-thoria, which is based on the same data as Fig. 7.4 but includes a threshold stress, τtr, of 2 x l0-5 μ (Chapter 17, eqn. (17.35)). Such a threshold may exist for all dispersion-strengthened alloys, but it is generally small and data for it are meagre.
The combined effects of a solid solution and a dispersion can be seen, particularly in the power-law creep field, by a careful comparison of the maps for nichrome (Figs. 7.1 and 7.2), thoriated nickel (Fig. 7.4) and thoriated nichromes (Figs. 7.6 and 7.7). The two strengthening methods, acting together, slow creep more effectively than either one acting alone. In addition, the dispersion suppresses dynamic recrystallization.
The nickel-based superalloy (Betteridge and Heslop, 1974) [2] combine a concentrated solid solution (typically of Cr and Co) with a large volume fraction of the precipitate Ni3(Al,Ti) and a lesser volume fraction of carbides, much of it in grain boundaries. The maps shown here (Figs. 7.8 and 7.9) are largely based on data for MAR-M200, but their purpose is to illustrate the major features of the superalloys generally. The yield strength is raised to roughly the ultimate strength of nickel, and power-law creep is drastically slowed. Very little is known about diffusional flow in the superalloys, but its field of dominance is likely to be large. Dynamic recrystallization is anticipated at temperatures above those at which the γ' precipitate and the M23C6 and M7C3 carbides dissolve.
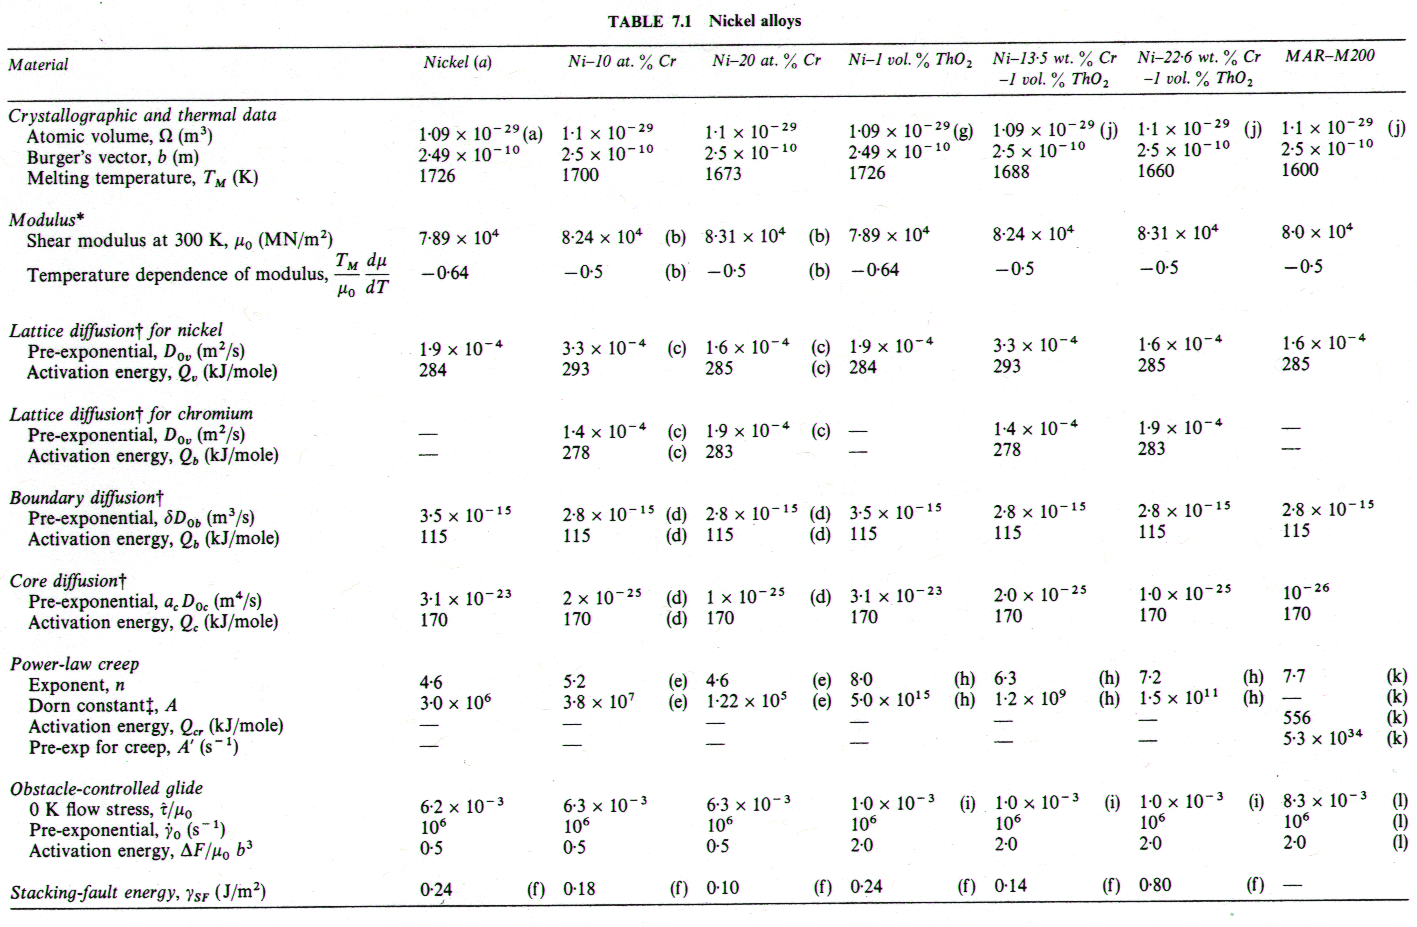
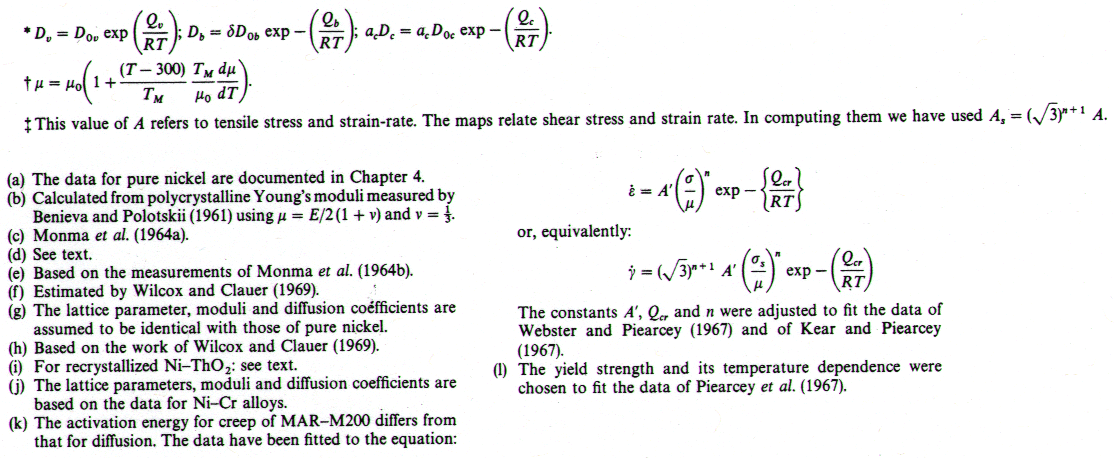
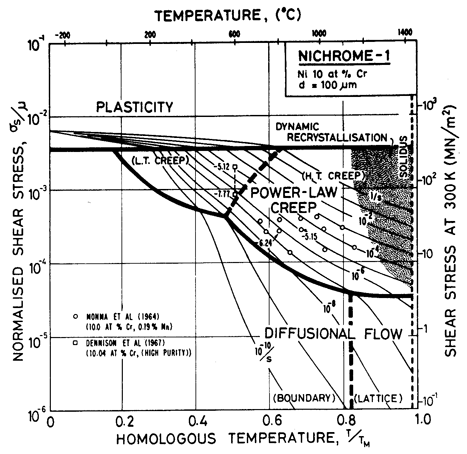
Fig. 7.1. Nickel-10 at.% chromium of grain size 100 µm, showing data. The temperature is normalized by the melting point of pure nickel (1726 K).
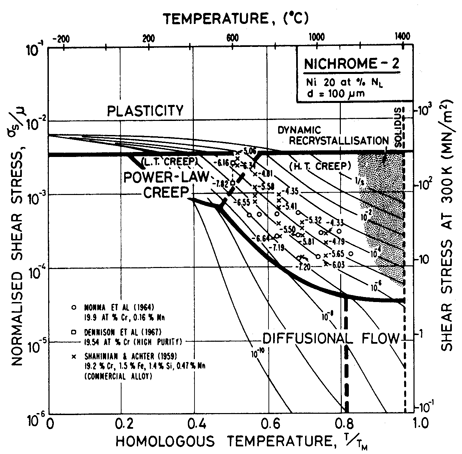
Fig. 7.2. Nickel-20 at.% chromium of grain size 100 µm, showing data. The temperature is normalized by the melting point of pure nickel (1726 K).
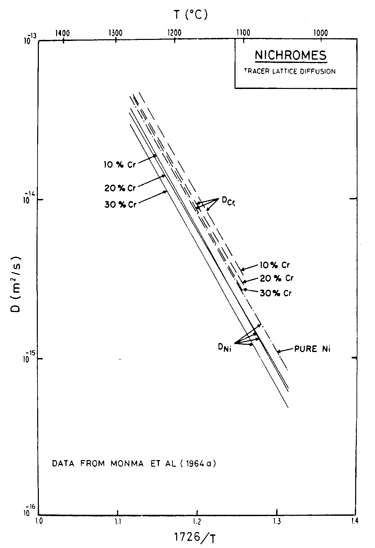
Fig. 7.3. Lattice diffusion of nickel and chromium in Ni-Cr alloys of three compositions, from Monma et al. (1964a) [3]. The temperature is normalized by the melting point of pure nickel (1726 K).
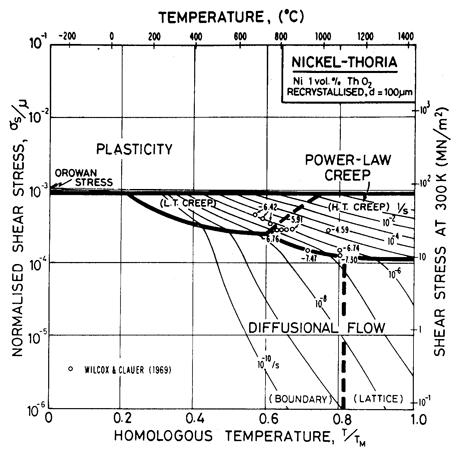
Fig. 7.4. Nickel 1 vol.% thoria of grain size 100 µm.
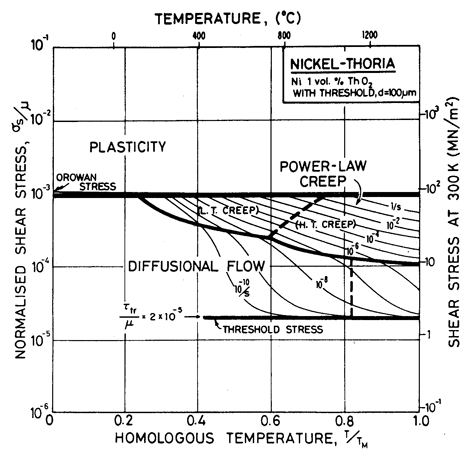
Fig. 7.5. Nickel 1 vol.% thoria of grain size 100 µm showing the way the map is changed if the dispersion pins grain boundary dislocations giving a threshold stress
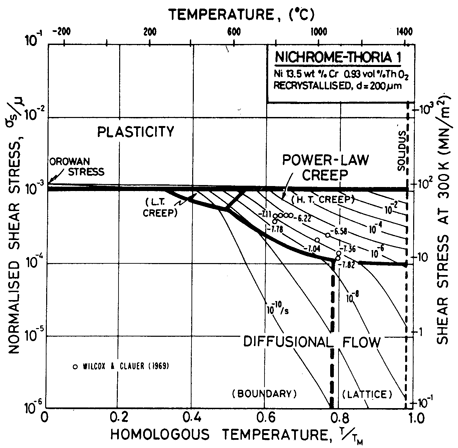
Fig. 7.6. Nickel 13.5 wt.% Cr-0.93 vol.% ThO2 of grain size 200 µm, recrystallized.
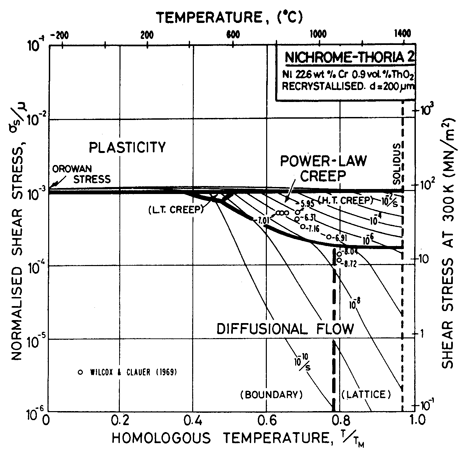
Fig. 7.7. Nickel 22.6 wt.% Cr-0.9 vol.% ThO2 of grain size 200 µm, recrystallized.
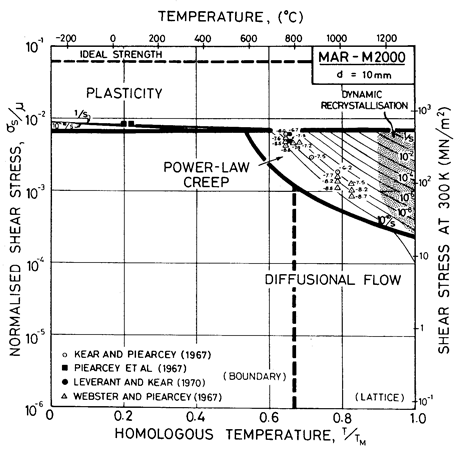
Fig. 7.8. MAR-M200 with a grain size of 10 µm, as cast, showing data from single-crystal samples.
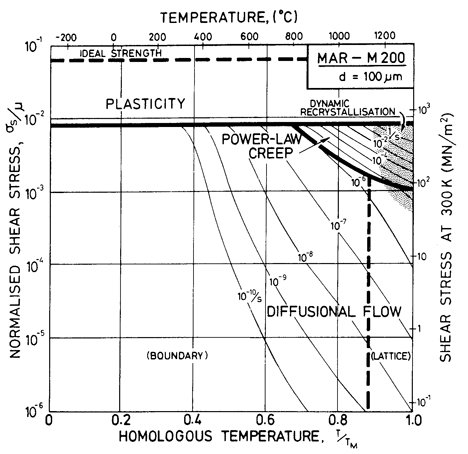
Fig. 7.9. MAR-M200 with a grain size of 100 µm, as cast.
7.2 ORIGINS OF THE DATA FOR NICKEL-BASED ALLOYS
|
Solution-strengthened nickel: the nichromes (Figs. 7.1 and 7.2) |
The maps for both Ni-10% Cr (Fig. 7.1) and Ni-20% Cr (Fig. 7.2) are plotted with the temperature scale normalized to the melting temperature of pure nickel in order to facilitate direct comparison. On both, the solidus temperature is marked. Shear moduli were calculated from the polycrystal data for Young's moduli of Benieva and Polotskii (1961) [4], using μ0 = (3/8)E0.
Alloying slows lattice diffusion in these alloys (Monma et al., 1964a) [3] as shown in Fig. 7.3. Table 7.1 lists the diffusion coefficients for both nickel and chromium; in evaluating the rate equations we calculated an effective diffusion coefficient from these, as described in Chapter 2, eqn. (2.27).
We have found no data for boundary or core diffusion in these alloys, and have therefore used the same activation energies as for pure nickel, but have adjusted the pre-exponentials in the ways outlined below. Gleiter and Chalmers (1972) [5] point out that boundary diffusion may be either enhanced or reduced by the addition of a solute; the same should apply to dislocation core diffusion. Because the presence of chromium reduces the rate of lattice diffusion of nickel, we have assumed that boundary diffusion is similarly reduced, and have taken D0B to be 80% of the value for pure nickel.
For core diffusion there is direct evidence for such a reduction. Dennison et al. (1967) [6] find an activation energy for creep at 0.5 TM of 284 kJ/mole (10% Cr) and 309 kJ/mole (20% Cr), which match the activation energies for lattice diffusion. The location of their data on the map also requires a lower corediffusion coefficient. Accordingly, we have used acD0c = 2 x 10-25 m4/s for 10% Cr and 1 x 10-25 m4/s for 20 Cr. This reduces the extent of the low temperature creep field compared with pure nickel, although it still leaves the data of Dennison et al. (1967) [6] within that field. A similar reduction is found in the stainless steels and is discussed in Chapter 8.
The parameters for power-law creep are derived from Monma et al. (1964b) [7] whose data are plotted on the maps. Their data agree well with the creep data for commercial Ni-20% Cr of Shahinian and Achter (1959) [8].
Dynamic recrystallization is observed in monels (Ni-Cu solid solutions) at above 1050°C and strain rates of 10-5 /s (Gandhi and Ashby, unpublished work). Similar behaviour is expected in the nichromes and is indicated as a shaded field.
|
Dispersion-strengthened nickel: nickel-thoria and nickel-chromium-thoria alloys (Figs. 7.4 to 7.7) |
The maps are based on creep data reported by Wilcox and Clauer (1969) [1]. Figs. 7.4 and 7.5 show Ni-1 vol.% ThO2; Fig. 7.6 is for Ni-13 wt.% Cr-l vol.% ThO2; and Fig. 7.7 is for Ni-22.6 wt.% Cr-1 vol.% ThO2, all three in the recrystallized state. The creep data of Wilcox and Clauer are plotted on each. Diffusion coefficients can reasonably be assumed to be the same as those for pure nickel and the Ni-Cr alloys. Moduli, too, have been set equal to those for nickel and nichrome, although this is less reasonable because, in the worked state, the dispersion-strengthened alloys have a marked texture which lowers the modulus in the rolling direction.
The grain size for the Ni-1 % ThO2 alloy (d = 0.1 mm) is an estimate made from published micrographs. A slightly larger grain size (d = 0.2 mm) was used for Ni-Cr-ThO2 alloys because the smaller value incorrectly places much of the creep data in the diffusional flow field (the high observed stress component of between 6 and 8 indicates power-law creep). There are no reports of diffusional flow in thoriated nickel and nichromes. The field was calculated using the diffusion coefficients for pure nickel and for the nichromes described earlier. The threshold stress shown in Fig. 7.5 is based on creep data for Cu-Al2O3 and Au-Al2O3 alloys, and on theory, presented in Chapter 17, Section 17.3.
The dislocation glide field is based on the initial yield stress for the fully recrystallized alloy (well approximated by the Orowan stress, μ0b/l where l is the spacing of thoria particles). The plasticity fields extend to lower stress than do those for the Ni-Cr alloys because the latter describe the work-hardened state. The thoriated alloys show a higher rate of work-hardening, and are normally used in a work-hardened state, when their low-temperature strength is higher than of the solid solution alloys.
The thoria particles in these alloys are stable up to the melting point and completely suppress dynamic recrystallization.
MAR-M200 is a nickel-based superalloy strengthened by a solid solution of W, Co and Cr, and by precipitates of Ni3(Ti,Al) and carbides of the types M23C6 and M7C3. A typical composition is given in Table 7.2. Fig. 7.8 shows a map corresponding to grain size of 10 µm. On it are plotted data for single crystal MAR-M200.
TABLE 7.2 Nominal composition of MAR-M200 in wt.%
|
Al |
Ti |
W |
Cr |
Nb |
Co |
C |
B |
Zr |
Ni |
|
5.0 |
2.0 |
12.5 |
9.0 |
1.0 |
10.0 |
0.15 |
0.015 |
0.05 |
Bal |
Alloying lowers the melting point substantially (to 1600 K), and raises the shear modulus slightly (to 80 GN/m2) compared with pure nickel. Lacking more complete data, we have taken the coefficient for lattice and boundary diffusion to be the same as those for high-alloy nichrome. The dispersion of Ni3(Al,Ti), superimposed on the heavy solid-solution strengthening of the W and Cr, gives MAR-M200 (and alloys like it) a yield strength comparable with the ultimate strength of pure nickel, although it is less dependent on temperature (Ver Snyder and Piearcey, 1966) [9]. The alloying also reduces greatly the rate of power-law creep, the field of which is based on the data of Webster and Piearcey (1967) [10], Kear and Piearcey (1967) [11] and Leverant and Kear (1970) [12].
These differences can be seen by comparing Figs. 7.9, for fine-grained MAR-M200 with that for pure nickel of the same grain size (Fig. 1.2). Precipitation strengthening and solution hardening have raised the yield line, and have reduced drastically the size of the power-law creep field. They also change the rate of diffusional flow (Whittenberger, 1977, 1981) [13, 14] though, since there are no experimental data for MAR-M200, we have made the assumption that it occurs at the same rate as it would in Ni-20% Cr alloy (but see Chapter 17, Section 17.3, and Fig. 7.5).
We are not aware of observations of dynamic recrystallization in MAR-M200, but above 1000°C the γ' phase dissolves, and at a slightly higher temperature the grain boundary carbides do so also (M23C6 at 1040 to 1095°C; M7C3 at 1095 to 1150°C; Betteridge and Heslop, 1974 [2]). This means that above 0.9 TM the alloy is a solid solution, and if the data cited earlier for solid solutions can be used as a guide, we would expect dynamic recrystallization. The shaded field is based on this reasoning.
1. Wilcox, B.A. and A.H. Clauer, Creep of dispersion-strengthened nickel-chromium alloys. Met. Sci. J, 1969. 3: p. 26-33.
2. Betteridge, W. and J. Heslop, Nimonic Alloys. 2 ed. 1974: Arnold.
3. Monma, K., H. Suto, and H. Oikawa, J. Jap. Inste Met., 1964a. 28: p. 188.
4. Benieva, T.Y. and I.G. Polotskii, Fiz. Metalloved., 1961. 12: p. 584.
5. Gleiter, H. and B. Chalmers, High-angle grain boundaries. Prog. Mat. Sci., 1972. 16: p. 1 or 93.
6. Dennison, J.P., R.J. Llewellyn, and B. Wilshire, The creep and failure properties of some nickel-chromium alloys at 600o C. J. Inst. Met, 1967. 95: p. 115.
7. Monma, K., H. Suto, and H. Oikawa, J. Jap. Inst. Met., 1964b. 28: p. 253.
8. Shahinian, P. and M.R. Achter, A comparision of the creep-rupture properties of nickel in air and in vacuum. Trans. AIME, 1959. 215: p. 37-41.
9. Ver Snyder, F.L. and B.J. Piearcey, SAE June 74. 1966?: p. 36.
10. Webster, G.A. and B.J. Piearcey, An interpretation of the effects of stress and temperature on the creep properties of a nickel-base superalloy. Met. Sci. J., 1967. 1: p. 97-104.
11. Kear, B.H. and B.J. Piearcey, Tensile and creep properties of single crystals of the nickel-base superalloy Mar-M200. Trans. Met. Soc. AIME, 1967. 239: p. 1209.
12. Leverant, G.R. and B.H. Kear, 1970. 1: p. 491.
13. Whittenberger, J.D., Creep and tensile properties of several oxide dispersion strengthened nickel base alloys. Met. Trans., 1977. 8A: p. 1155.
14. Whittenberger, J.D., Elevated temperature mechanical properties and residual tensile properties of two cast superalloys and several nickel-base oxide dispersion strengthened alloys. Met. Trans., 1981. 12A: p. 193.