THE F.C.C. METALS: Ni, Cu, Ag, Al, Pb AND γ-Fe
4.1 General Features of Mechanical Behavior of F.C.C. Metals
4.2 Origins of the Data for the f.c.c. Metals
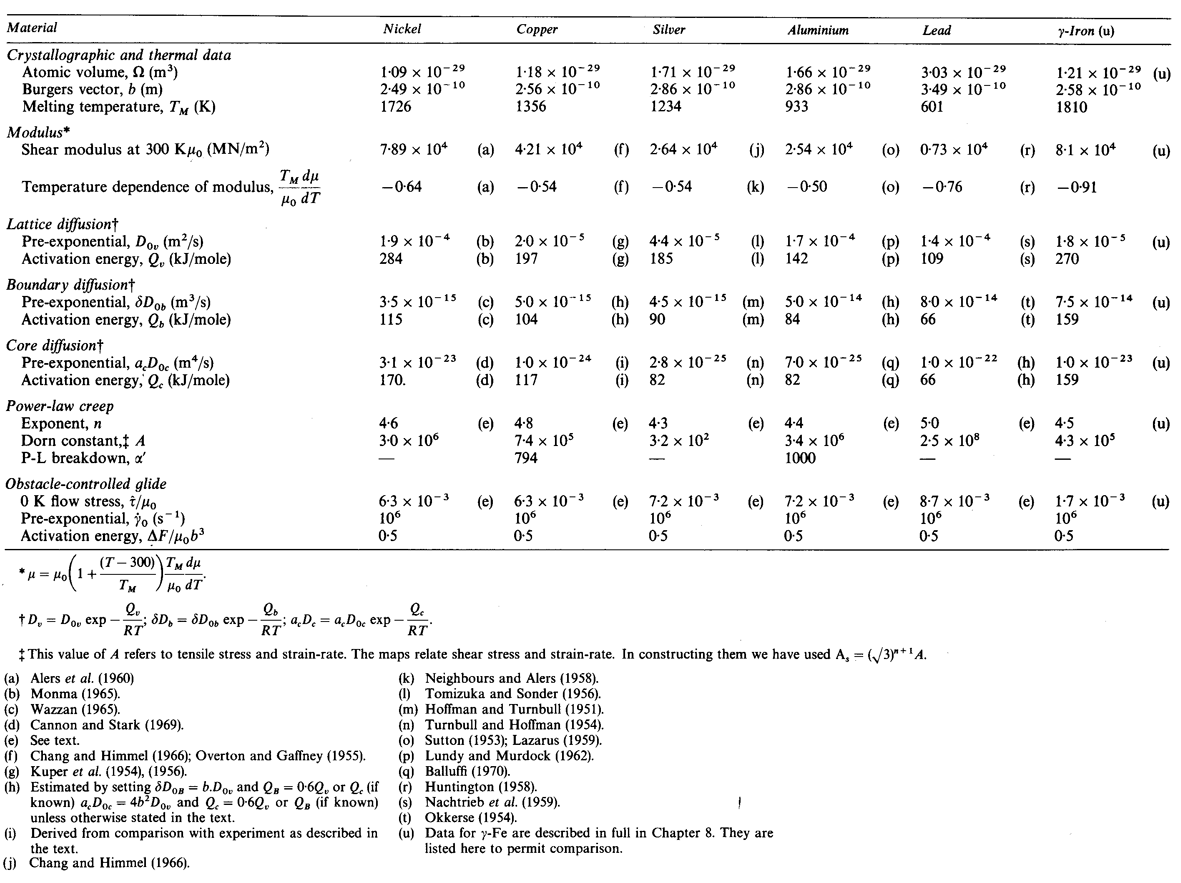
THE f.c.c. metals, above all others, are tough and ductile, even at temperatures close to 0 K. When annealed, they are soft and easily worked; but their capacity for work-hardening is sufficiently large that, in the cold-worked state, they have useful strength. Their capacity for alloying, too, is great, leading to ranges of materials, such as the aluminium alloys, the beryllium coppers, the stainless steels, and the nickel-based superalloys, which have remarkable yield and creep strengths. Maps for five pure f.c.c. metals (Ni, Cu, Ag, Al and Pb) are shown in Figs. 4.1 to 4.20. Those for non-ferrous alloys are given in Chapter 7; those for iron and stainless steels in Chapter 8. The maps are based on data plotted on the figures, and the parameters listed in Table 4.1.
 |
|
4.1 GENERAL FEATURES OF MECHANICAL BEHAVIOR OF F.C.C. METALS |
The maps for nickel (Figs. 4.1 to 4.4) typify those for the f.c.c. metals. All show three principal fields: low-temperature plasticity, power-law creep and diffusional flow. Occasionally (aluminium and lead are examples) a field of Harper-Dorn creep replaces that of diffusional flow, and in two instances (copper and aluminium) power-law breakdown is shown.
The f.c.c. metals are remarkable in having an extremely low lattice resistance (certainly less than 10-5 μ); as a result their yield strength is determined by the density of discrete obstacles or defects they contain.*When pure, it is the density and arrangement of dislocations that determines the flow stress, which therefore depends on the state of workhardening of the metal. Most of the maps describe work-hardened material, and were computed by using a dislocation density of 6.25 x 10¹⁴ /m2 (or an obstacle of l = 4 x 10⁻⁸ m, see Chapter 2, Table 2.1). This choice describes a heavily deformed state, although it is still well below the highest known densities and is not therefore a saturation or steadystate density. Annealing lowers the yield strength to about σs / μ = 10-3 for typical commercial purity f.c.c. metals (corresponding to l ≈ 2 x 10⁻⁷ m); a map for annealed nickel is shown in Fig. 4.4. The activation energy for forest cutting is taken as ∆F = 0.5 μb3 (Table 2.1) leading to a flow strength which depends only weakly on temperature. This value is slightly larger than the best estimates (Hirth and Lothe, 1968 [1]) but the effect of this difference is undetectable on the maps shown here.
* The refractory f.c.c. metals Ir and Rh are exceptional in exhibiting a large lattice resistance: roughly 10-2 µ at O K.
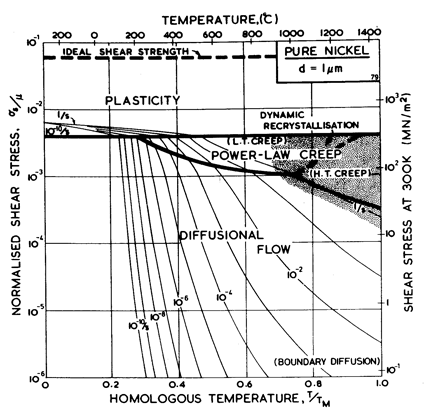
Fig. 4.1. Pure nickel of grain size 1 µm, work-hardened; the obstacle spacing l is taken as 4 x 10⁻⁸ m.
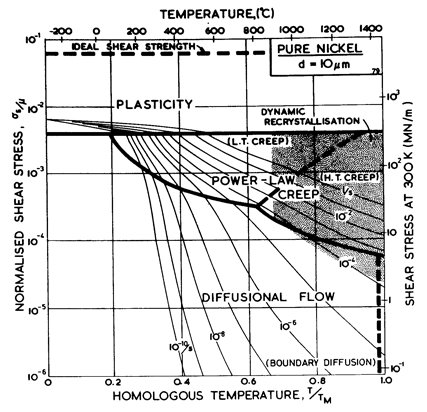
Fig. 4.2 Pure nickel of grain size 1 µm, work-hardened, as Fig. 4.1.
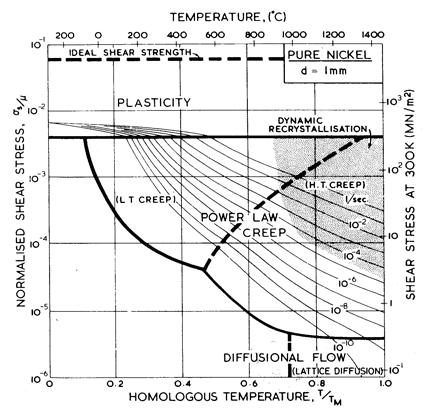
Fig. 4.3. Pure nickel of grain size 1 mm, work-hardened, as Fig. 4.1.
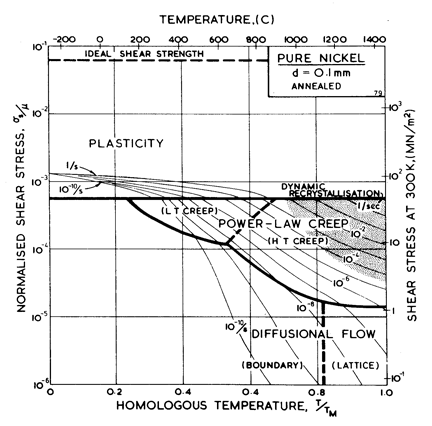
Fig. 4.4. Pure nickel of grain size 0.1 mm, annealed. The obstacle spacing, l, is taken as 2 x 10⁻⁷ m.
Above about 0.3 TM , the f.c.c. metals start to creep. Diffusion (which is thought to control creep in these metals) is slower in the f.c.c. structure than in the more-open b.c.c. structure; this is reflected in lower creep-rates at the same values of σs / μ and T/TM. The creep field is subdivided (Chapter 2, eqn. (2.20)) into a region of low-temperature, corediffusion controlled creep in which the stress exponent is about n + 2, and a region of hightemperature, lattice-diffusion controlled creep in which the stress exponent is n. The power-law breaks down for all five metals near σs / μ = 10-3, corresponding to a value of α' of about 103. Sufficient data are available for two of them (Cu and Al) to include this on the maps with real confidence.
Diffusional flow appears at high temperature and low stress. The field is subdivided (Chapter 2, eqn. (2.30)) into a region in which boundary diffusion controls the creep-rate and one in which lattice diffusion is controlling. When the grain size is large this field may be replaced by one of Harper-Dorn creep (Chapter 2, eqn. (2.23)); examples are given below in the sections on Al and Pb.
The effect of grain size on the maps is illustrated by Figs. 4.1, 4.2, 1.2 and 4.3. Taken in this order, they form a sequence between each of which the grain size increases by a factor of 10. In doing so, the power-law creep field expands at the expense of diffusional flow; lattice-diffusion becomes dominant, displacing boundary diffusion in the control of diffusional flow, and (as mentioned above) Harper-Dorn creep may appear, though there is no direct evidence for it in nickel.
The moduli of all five metals were calculated from single-crystal data using
|
|
It is this value which enters the anisotropic calculation of the elastic energy of a 1/2<110> screw dislocation, and therefore appears in estimates of the force required to cause screws to intersect, or in calculations of the force required to bow an edge dislocation between strong obstacles. We have incorporated a linear temperature dependence— a reasonably accurate approximation for these metals. Plasticity, creep and diffusion data are discussed below.
4.2 ORIGINS OF THE DATA FOR THE f.c.c. METALS
Nickel (and its alloys, Chapter 7) is covered in more detail than any other material in this book. Figs. 4.1, 1.2, 4.2 and 4.3, show, in sequence, maps for grain sizes between 1µm and 1 mm in the workhardened state. Figs. 1.3 to 1.6 show other ways of plotting the same information. Finally, Fig. 4.4 shows a map describing nickel in the annealed state. All are based on the data plotted in Figs. 4.5 and 4.6, and summarized in Table 4.1.
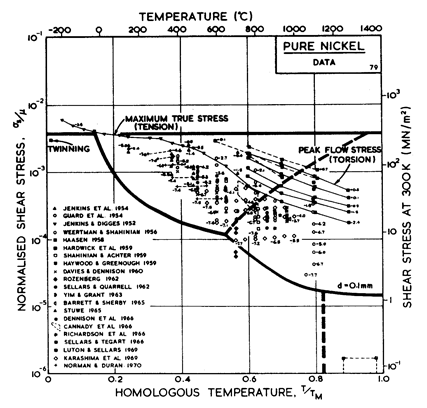
Fig.4.5. Data for.nickel, divided
into blocks. Each block is fitted to a rate-equation. The numbers are
log10 ( ).
).
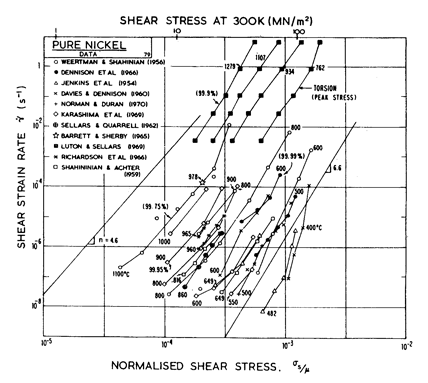
Fig.4.6. Creep data for nickel. Data are labelled with the temperature in °C.
The high-temperature creep parameters are based on the measurements of Weertman and Shahinian (1956) [2] of the creep of 99.75% Ni with n = 4.6 in the high-temperature region. It has been shown, however (Dennison et al., 1966) [3], that small amounts of impurities (~ 0.1%) may lower the creep rate of nickel by up to an order of magnitude. We have therefore used a value of A of 3.0 x 10⁶, almost an order of magnitude greater than would be derived from Weertman and Shahinian (1956) [2]. This value provides a much closer correspondence to the peak flow stress in torsion data of Luton and Sellars (1969) [4], and other various data near the H.T. creep L.T. creep boundary of Fig. 4.5.
For low-temperature
creep we have used the core-diffusion coefficient given by Canon and
Stark (1969) [5] for edge dislocations in a symmetric tilt boundary.
The activation energy for this (Qc= 170 kJ/mole) matches that found
by Norman and Duran (1970) [6] for creep in the L.T. creep regime. In addition,
Norman and Duran [6] find n
![]() 7.0, which supports the existence of the low-temperature creep field. Their
strain-rates accurately match the numerical predication (using A = 3.0 x
106). Weertman and Shahinian [2] also find a low-temperature increase in the
stress exponent, although their strain-rates are lower. We have not
included power-law breakdown for nickel, though (by analogy with copper and aluminium) eqn. (2.26) with α' = 1000 should give an approximate description.
7.0, which supports the existence of the low-temperature creep field. Their
strain-rates accurately match the numerical predication (using A = 3.0 x
106). Weertman and Shahinian [2] also find a low-temperature increase in the
stress exponent, although their strain-rates are lower. We have not
included power-law breakdown for nickel, though (by analogy with copper and aluminium) eqn. (2.26) with α' = 1000 should give an approximate description.
The shaded field of dynamic recrystallization is based on the observations reported and reviewed by Ashby et al. (1979) [7].
A map for copper with a (typical) grain size of l00 µm, is shown in Fig. 4.7; it includes the broad transition from power-law creep to plasticity which we call power-law breakdown (Chapter 2, eqn.(2.26)). It is based on data shown in Figs. 4.8 and 4.9, and summarized in Table 4.1. Changes with grain size resemble those for nickel.
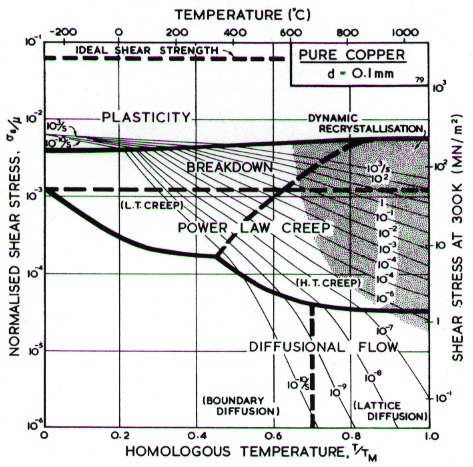
Fig.4.7. Pure copper with a grain size of 0.1 mm, including power-law breakdown.
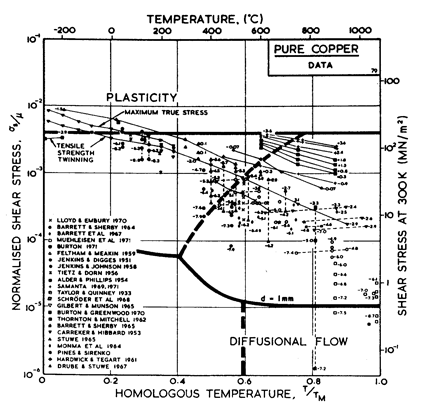
Fig. 4.8. Data for copper, divided
into blocks. The numbers are logl0 ( ).
).
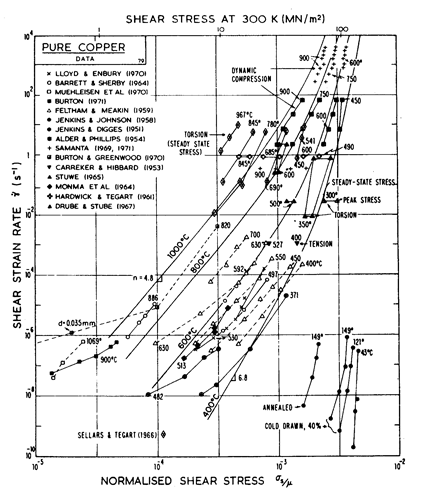
Fig. 4.9. Creep data for copper. Data are labelled with the temperature in °C.
The primary references for the high-temperature creep of copper are Feltham and Meakin (1959) [8] and Barrett and Sherby (1964) [9]. For the low-temperature creep field we have used a core diffusion activation energy of 117 kJ/mole, chosen to match the activation energy for low-temperature creep found by Barrett and Sherby (1964) [9]; there does not appear to be any experimental determination of core or boundary diffusion coefficients for copper. Power-law breakdown is calculated using eqn. (2.26) with α' = 7.94 x 10², chosen to match the dynamic compression data of Alder and Phillips (1954) [10] and Samanta (1969, 1971) [11, 12].
The field of dynamic recrystallization is based on observations of Fleck et al. (1970) [13] and of Ruckweid (1972) [14].
Fig.4.10 shows a map for silver with a large grain size: 1 mm. It closely resembles those for copper and for nickel (which showed how grain size influences the maps). It is based on data plotted in Figs. 4.11 and 4.12, and summarized in Table 4.1.
There has been less work on the creep of silver than on other common f.c.c metals. The high-temperature creep parameters are based on Leverant et al. (1966) [15]. For the low-temperature creep field, the average dislocation core diffusion coefficient given by Turnbull and Hoffman (1954) [16] has been used. This gives good agreement with the creep data of Carreker and Guard (1955) [17] and of Schroder et al. (1968) [18].
The field of dynamic recrystallization is based on observations of Ashby et al. (1979) [7].
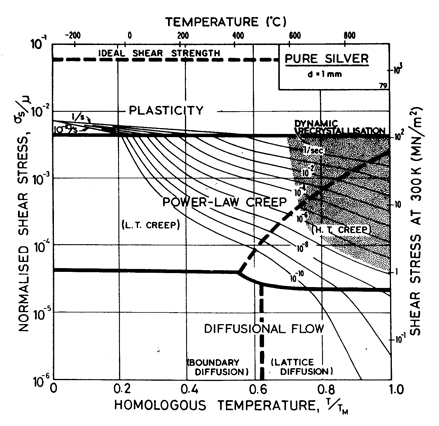
Fig. 4.10. Pure silver in grain size 1 mm.
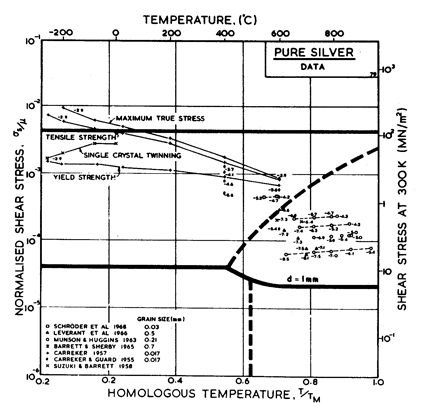
Fig. 4.11. Data for silver, divided
into blocks. The numbers are log10 ( ).
).
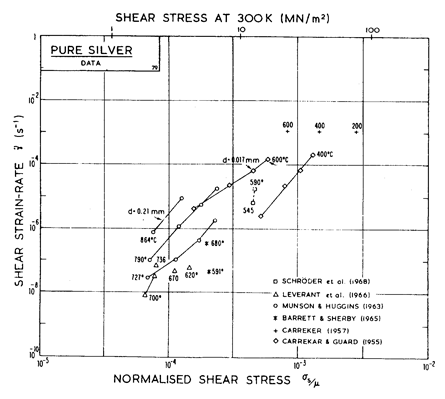
Fig. 4.12. Creep data for silver. Data are labelled with the temperature in °C.
Two maps, Figs. 4.13 and 4.14, are given for aluminium to show how Harper-Dorn (eqn. (2.23)) creep displaces diffusional flow at large grain sizes. Both include power-law breakdown (eqn. (2.26)). The maps are based on the data plotted in Figs. 4.15 and 4.16, and summarized in Table 4.1.
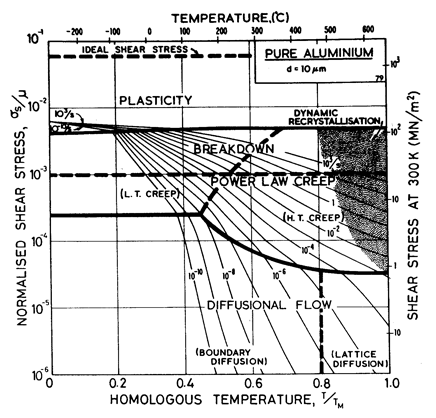
Fig.4.13. Pure aluminium of grain size 10 µm, including power-law breakdown.
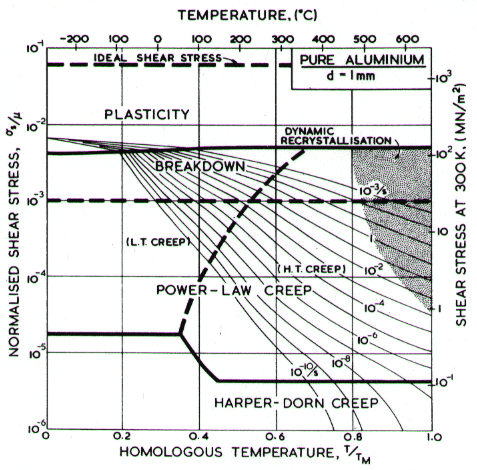
Fig. 4.14. Pure aluminium of grain size 1 mm. HarperDorn creep has displaced diffusional flow.
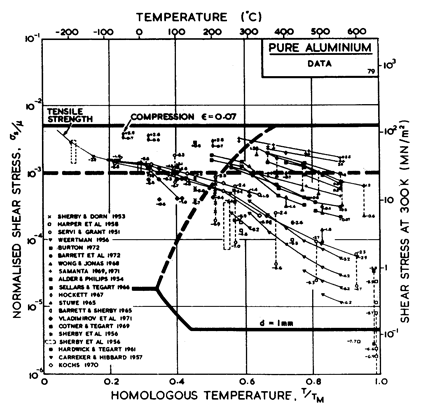
Fig. 4.15. Data for aluminium,
divided into blocks. The numbers are log10 ( ).
).
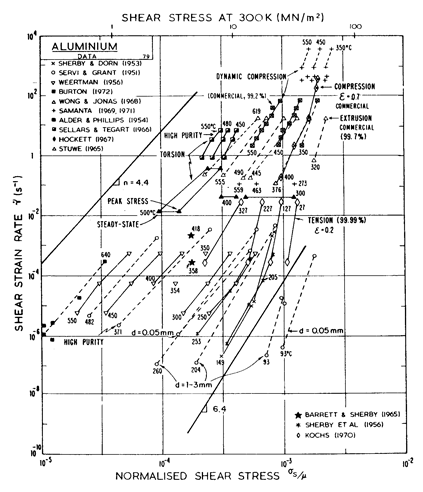
Fig. 4.16. Creep data for aluminium. Data are labelled with the temperature in °C.
The high-temperature creep parameters for aluminium are based on Weertman (1956) [19] and Servi and Grant (1951) [20]. At high temperatures, these studies show an activation energy in agreement with the diffusion coefficient of Lundy and Murdock (1962) [21]: Qυ= 142 kJ/mole. For low-temperature creep we have used the dislocation core diffusion coefficient cited. by Balluffi (1970) [22]: Qc = 82 kJ/mole, which provides good agreement with low-temperature creep experiments. The Harper-Dorn creep field is based on data of Harper et al. (1958) [23]. It appears on Fig.4.14 for d = 1 mm, but is suppressed by diffusional flow at d = 10 µm, as shown in Fig. 4.13.
The power law breakdown region of aluminium has been extensively studied; experimental data have been fitted to a hyperbolic sine equation (eqn. (2.25)) by Wong and Jonas (1968) [24] and Sellars and Tegart (1966) [25]. Data for commercial purity aluminium, obtained from dynamic compression tests (Alder and Phillips, 1954 [10]; Samanta, 1969, 1971 [11, 12]; and Hockett, 1967 [26]) and extrusion tests (Wong and Jonas, 1968)[24] show much lower strain-rates than data from high-purity aluminium tested in torsion (Sellars and Tegart, 1966) [25] and from the extrapolation of creep data (Servi and Grant, 1951) [20]. Both sets of data cannot be matched by the same powerlaw breakdown parameter. The value used for both maps (α' = 1 x 10³) provides an intermediate approximation. The field appears here as a general demonstration, not as an exact representation of experiment.
Above 0.8 TM, rapid grain growth occurs in aluminium during creep (Servi and Grant, 1951 [20]) giving unstable creep. The shaded region refers to this rather than true dynamic recrystallization, which is rarely observed.
Lead, like aluminium, exhibits Harper-Dorn creep when the grain size is large. This is illustrated by the two maps (Figs. 4.17 and 4.18). They are based on data plotted in Figs. 4.19 and 4.20 and summarized in Table 4.1.
Our high-temperature creep parameters are based on Mohamed et al. (1973) [27]: n = 5.0, A = 2.5 x 10⁸. These differ from those that could be derived from the single-crystal creep experiments of Weertman (1960) [28], which show a slightly lower n at high temperatures. We have used a diffusion activation energy of 109 kJ/mole (Resing and Nachtrieb, 1961) [29] which is higher than the value found by Mohamed et al. (1973) [27], and lower than the value derived from Weertman (1960) [28].
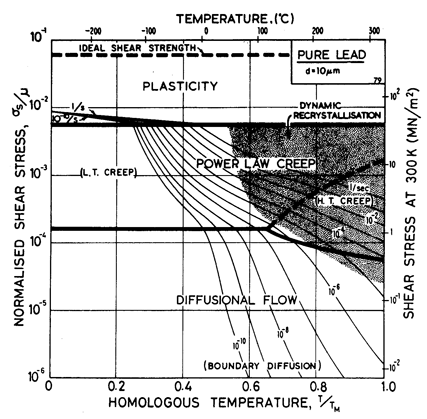
Fig. 4.17. Pure lead of grain size 10 µm.
Low-temperature creep behavior is indicated by a number of studies. Weertman's (1960) [28] data at low temperatures show a higher stress exponent and a lower activation energy than at high. Data of Feltham (1956) [30], again in the low-temperature creep regime, show an apparent activation energy of 92 kJ/mole with n ≥ 7 (compared with 109 kJ/mole and 5 at high). Room temperature data of Gifkins (1952, 1959) [31, 32] and Nichols and McCormick (1970) [33] show n ≈ 8. The dislocation core diffusion coefficient is taken to match the boundary diffusion data of Okkerse (1954) [34]: Qc= 65 kJ/mole. The Harper-Dorn creep field is based on Mohamed et al. (1973) [35]. It appears for d = 1 mm (Fig. 4.18), but is masked by diffusional flow when d = 10 µm (Fig. 4.17).
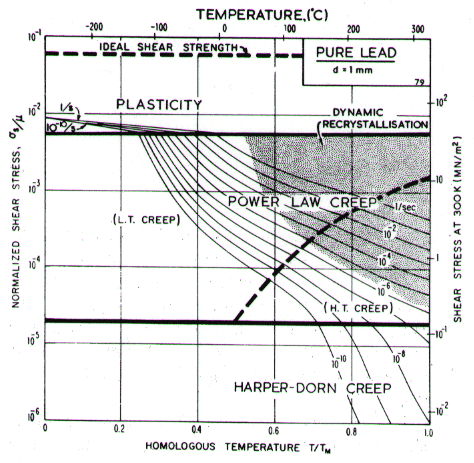
Fig. 4.18. Pure lead of grain size 1 mm. Harper-Dorn creep has displaced diffusional flow.
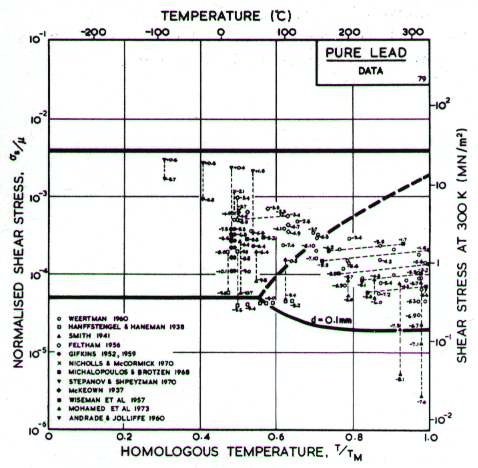
Fig.4.19. Data for lead, divided
into blocks. The numbers are log10 ( )
)
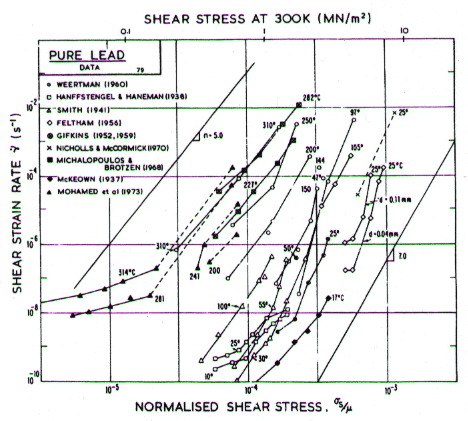
Fig.4.20. Creep data for lead. Data are labelled with the temperature in °C.
Diffusion in lead, at a given T/TM, is exceptionally slow. For this reason the rate of diffusional flow of lead, at a given homologous temperature, is slower than that of other f.c.c. metals.
Dynamic recrystallization is observed in lead at above 0.7 TM The field is based on the observations of Hanson and Wheeler (1931) [36], Greenwood and Worner (1939) [37] and Gohn et al. (1946) [38].
Austenite: γ-iron (Figs. 8.1 to 8.3)
Parameters for austenite are included in Table 4.1 for comparative purposes. The map for iron, and the origins of the data, are described in detail in Chapter 8.
1. Hirth, J.P. and J. Lothe, Theory of Dislocations. 1968: McGraw-Hill. 435.
2. Weertman, J. and P. Shahinian, Trans. AIME, 1956. 206.
3. Dennison, J.P., R.J. Llewellyn, and B. Wilshire, The Creep and Fracture Behaviour of Some Dilute Nickel Alloys at 500 and 6000 C. J. Inst. Met., 1966. 94: p. 130-34.
4. Luton, M.J. and C.M. Sellars, Dynamic recrystallization in nickel and nickel-iron alloys during high temperature deformation. Acta Metallurgica (pre 1990), 1969. 17: p. 1033.
5. Canon, R.F. and J.P. Stark, Grain boundary self-diffusion in nickel. Journal of Applied Physics, 1969. 40: p. 4366-73.
6. Norman, E.C. and S.A. Duran, Steady-state creep of pure polycrystalline nickel from 0.3 to 0.55 Tm. Acta Metallurgica, 1970. 18: p. 723.
7. Ashby, M.F., C. Gandhi, and D.M.R. Taplin, Fracture-mechanism maps and their construction for FCC metals and alloys. Acta Metallurgica (pre 1990), 1979. 27: p. 699.
8. Feltham, P. and J.D. Meakin, Creep in face-centered cubic metals with special reference to copper. Acta Metallurgica (pre 1990), 1959. 7: p. 614.
9. Barrett, C.R. and O.D. Shearby, Steady-state creep characteristics of polycrystalline copper in the temperature range 400 degrees to 950 degrees C. Trans. AIME, 1964. 230: p. 1322-27.
10. Alder, J.F. and V.A. Phillips, The effect of strain rate and temperature on the resistance of aluminium, copper, and steel to compression. J.Inst. Met., 1954. 83: p. 80-86.
11. Samanta, S.K., On relating the flow stress of aluminium and copper to strain, strain-rate and temperature. Int. J. Mech. Sci., 1969. 11: p. 433-53.
12. Samanta, S.K., Dynamic deformation of aluminium and copper at elevated temperatures. J. Mech. Phys. Solids, 1971. 19: p. 117-35.
13. Fleck, R.G., G.J. Cocks, and D.M.R. Taplin, The influence of polycrystal grain size upon the creep ductility of copper. Met. Trans., 1970. 1: p. 3415.
14. Ruckweid, A., High temperature creep cavitation mechanisms in a continuously cast high purity copper. Met. Trans., 1972. 3: p. 3009.
15. Leverant, G.R., F.V. Lenel, and G.S. Ansell, Trans. ASM, 1966. 59: p. 890.
16. Turnbull, D. and R.E. Hoffman, The effect of relative crystal and boundary orientations on grain boundary diffusion rates. Acta Metallurgica (pre 1990), 1954. 2: p. 419.
17. Carreker, R.P., Jr. and R.W. Guard, Report No. 55-R1-1414. 1955?, General Electric Co., Schenectady, N.Y.
18. Schroder, K., A.J. Giannuzzi, and G. Gorscha, The effect of annealing in air on the steady state creep rate of copper and silver at low pressures. Acta Met., 1968. 16: p. 469.
19. Weertman, J., Creep of polycrystalline aluminium as determined from strain rate tests. J. Mech. Phys. Solids, 1956. 4: p. 230-234.
20. Servi, I.S. and N.J. Grant, Creep and stress rupture behavior of aluminium as a function of purity. Trans. AIME, 1951. 191: p. 909.
21. Lundy, T.S. and J.F. Murdock, Diffusion of Al26 and Mn54 in Aluminium. Journal of Applied Physics, 1962. 33: p. 1671.
22. Balluffi, R.W., On Measurement of Self-Diffusion rates along Dislocations in F.C.C. Metals. Phys. Stat. Sol., 1970. 42: p. 11-34.
23. Harper, J.G., L.A. Shepard, and J.E. Dorn, Creep of aluminum under extremely small stresses. Acta Metallurgica (pre 1990), 1958. 6: p. 509.
24. Wongi, W.A. and J.J. Jonas, Aluminium extrusion as a thermally activated process. Trans. AIME, 1968. 242: p. 2271-2280.
25. Sellars, C.M. and W.J.M. Tegart, La relation entre la resistance et la structure dans la deformation a chaud. Mem. Sci. Rev. Met., 1966. 63: p. 731-46.
26. Hockett, J.E., On relating the flow stree of aluminium to strain, strain rate and temperature. Trans. AIME, 1967. 239: p. 969.
27. Mohamed, F.A., K.L. Murty, and J.W. Morris, Jr., Harper-Dorn creep in Al, Pb, and Sn. Met. Trans, 1973. 4: p. 935.
28. Weertman, J., Creep of indium, lead and some of their alloys with various other metals. Trans. AIME, 1960. 218: p. 207-18.
29. Resing, H.A. and N.H. Nachtrieb, J. Phys. Chem. Solids, 1961. 21: p. 40.
30. Feltham, P. 1956: Proc. Phys. Soc.
31. Gifkins, R.C., J. Inst. Met., 1952. 81: p. 417.
32. Gifkins, R.C., Trans. AIME, 1959. 215: p. 1015.
33. McCormick, P.G. and A.L. Ruoff, in Mechanical Behaviour of Materials under Pressure, H.l.D. Pugh, Editor. 1970, Elsevier.
34. Okkerse, B., Self-diffusion in lead. Acta Met., 1954. 2: p. 551.
35. Mohamed, F.A., K.L. Murty, and J.W. Morris, Jr. in The John E. Dorn Memorial Symposium. 1973. Cleveland, Ohio: ASM.
36. Hanson, D. and M.A. Wheeler, J. Inst. Met., 1931. 45: p. 229.
37. Greenwood, J.N. and H.K. Worner, J. Inst. Met., 1939. 64: p. 135.
38. Gohn, G.R., S.M. Arnold, and G.M. Bouton, Creep tests on some extruded lead and lead alloy sleeves and tapes. Proc. ASTM, 1946. 46: p. 990.
