THE ALKALI HALIDES: NaCl AND LiF
10.1 General Features of the Deformation of Alkali Halides
10.2 Data for Sodium Chloride, NaCl
10.3 Data for Lithium Fluoride, LiF
SODIUM CHLORIDE and lithium fluoride typify a large group of alkali halides with the rock-salt structure. The unit cell can be thought of as two interpenetrating face-centred cubic sublattices, each ion surrounded octahedrally by six ions of the other charge. The unit cell contains four ions of each type.
More than 200 compounds with this structure are known. It occurs most commonly among alkali metal halides, the oxides of divalent transition metals, the alkaline earth oxides and calcogenides, and the transition metal carbides, nitrides and hydrides. But at least four mechanicallydistinguishable subgroups with this structure exist (see Chapter 17). Three are examined in this book: the alkali halides (this chapter), the transition metal carbides (Chapter 11) and the simple oxides (Chapter 12). The bonding of each subgroup is different, so that despite the similarity in structure, the mechanical strengths differ. The alkali halides are purely ionic in their bonding. Their maps are shown in Figs. 10.1 to 10.4. The parameters used to construct them are listed in Table 10.1.
TABLE 10.1 The alkali halides
|
Material |
Silicon |
|
Germanium |
|
|
|
Crystallographic and thermal data Atomic volume, Ω (m3) Burger's vector, b (m) Melting temperature, TM (K)
|
4.49 x 10⁻²⁹ 3.99 x 10⁻¹⁰ 1070
|
(a)
|
1.63 x 10⁻²⁹ 2.84 x 10⁻¹⁰ 1140
|
(a) |
|
|
Modulus Shear modulus at 300 K, μ0 (MN/m2) Temperature dependence
of modulus,
|
1.5 x 10⁴
—0.73
|
(b)
|
4.58 x 10⁴
—0.8
|
(b)
|
|
|
Lattice diffusion (anion) Pre-exponential, D0υ (m2/s) Activation energy, Qυ (kJ/mole)
|
2.5 x 10⁻² 217
|
(c)
|
7.4 x 10⁻³ 214
|
(g)
|
|
|
Boundary diffusion Pre-exponential, δD0b (m3/s) Activation energy, Qb (kJ/mole)
|
6.2 x 10⁻¹⁰ 155
|
(d)
|
— —
|
|
|
|
Core diffusion (anion) Pre-exponential, acD0c (m4/s) Activation energy, Qc (kJ/mole)
|
4.9 x 10⁻¹⁹ 155
|
(d)
|
— —
|
|
|
|
Power-law creep Exponent, n Dorn constant, A
|
3.6 6.6 x 10²
|
(e)
|
6.6 2.6 x 10¹³
|
(h)
|
|
|
Obstacle-controlled glide 0 K flow stress, Pre-exponential, Activation energy, ∆F/μ0b3
|
2.5 x 10⁻³
106 0.5
|
(f)
|
1.87 x 10⁻²
106 0.5
|
(i)
|
|
|
Lattice-resistance-controlled glide 0 K flow stress, Pre-exponential, Activation energy, ∆Fp/μ0b3
|
1.8 x 10⁻² 2.5 x 10¹¹
0.12 |
(f)
|
3.7 x 10⁻² 2.5 x 10¹¹
0.11 |
(i)
|
|
|
(a) Handbook of Chemistry and Physics (1973), with b=a/ √2. (b) Calculated
from single-crystal constants from the Landolt- (c)Best fit to diffusion plot for Cl– shown in text; Dυ = D0υ exp – (Qυ/RT). (d) Burke
(1968), Cl– ion diffusion;
δDb=δD0b exp– (Qb/RT), (e)Burke
(1968). His specimens contained the following impurities in less
than 10 ppm: Ag, Al, Ba, Ca, Co, Cr, Cu, Fe, Mg, Mn, Mo, Ni, Pb,
Si, Sn, Ti, V, Zn. Also Cd was present in less than 25 ppm. the value
of A is for tensile creep; the maps are constructed using |
(f) Parameters obtained by fitting eqns. (2.9) and (2.12) to data from Aldag et al. (1970) (100 µm grain size polycrystals of NaCl in compression at room temperature and pressures from atmospheric to 10 kbar at a strain-rate of 10-4/s) Stokes (1966) (100 µm grain size polycrystals at 5 x 10⁻¹⁰ /s; and temperatures of 150°C, 250°C and 350°C); Gilman (1961); and Verrall et al. (1977). (g) Matzke, Hj. (1971), and Naumov and Ptashnik (1968); see also note (c) (h) Cropper and Langdon (1968). The impurities in ppm, reported as oxides of the elements indicated were: Mg: 10, Ag: 5, Cu: 5, Al: 10, Cu: 4, Si: 150. The value of A refers to tensile stress and strain-rate (see Section 2.4); see also note (e). (i) Parameters obtained by fitting eqns. (2.9) and (2.12) to data from Verrall et al. (1977). |
||||
Like other polycrystalline materials, the plastic deformation of ionic solids involves a number of distinct mechanisms: low-temperature plasticity, power-law creep and diffusional flow. All three have been observed in alkali halides, among which LiF and NaCl are the most extensively studied.
At
low temperatures, NaCl and LiF slip most easily on {110}planes in the ![]() directions—but
these provide only two independent systems. For polycrystal plasticity, slip
on the harder {001} and {111} planes in the
directions—but
these provide only two independent systems. For polycrystal plasticity, slip
on the harder {001} and {111} planes in the ![]() directions is required, and it is
this which determines the flow strength (Gutmanas and Nadgornyi, 1970 [1]; see also Chapter 2, Section 2.2). Even at 250°C, flow is governed by the hard slip systems (Carter and Heard, 1970) [2].
directions is required, and it is
this which determines the flow strength (Gutmanas and Nadgornyi, 1970 [1]; see also Chapter 2, Section 2.2). Even at 250°C, flow is governed by the hard slip systems (Carter and Heard, 1970) [2].
Impurities influence the defect structure of ionic solids (and thus the rates of the mechanisms) in ways which are more complicated than in metals (see, for example, Greenwood, 1970) [3]. First, divalent impurities alter the concentration of vacancies (and other point defects) and thus affect the diffusion coefficients. A divalent impurity at concentration C0, for instance, stabilizes a cation vacancy concentration C0. At temperatures above that at which the thermal concentration of vacancies is C0, the impurities have little effect and cation diffusion is said to be intrinsic. At lower temperatures the impurity maintains the cation vacancy concentration at C0, and (by the law of mass-action) depresses the anion vacancy concentration to less than its thermal-equilibrium value in the pure solid. Diffusion is then influenced by the impurities, and is said to be extrinsic. Since anion diffusion usually controls the rate of mass-transport in the alkali halides, impurities of this sort can slow the rate of power-law creep and diffusional flow greatly.
A second effect of impurities is to alter the electrical charge carried by dislocations and grain boundaries (see, for example, Kliewer and Koehler, 1965) [4]. In sodium chloride at high temperatures, for example, dislocations carry a positive charge. Divalent cation impurities cause the ions to distribute themselves such that, at the isoelectric temperature TI, the charge changes sign. Above TI, each dislocation core carries an excess of Na+ ions, and a negative space charge caused by an excess of Na+ vacancies surrounds it. But below TI, the core carries an excess of Cl- ions surrounded by a positive space charge. For reasons which are not completely understood, this seems to enhance diffusion at or near the core, and may explain certain aspects of creep in NaCl discussed in Section 10.2 (below).
There is a third effect of impurities: divalent solutes cause rapid solution-hardening, raising the yield stress in the dislocation glide regime. Johnston (1962) [5], and Guiu and Langdon (1974) [6], found that the critical resolved shear stress of Mg2+ –doped LiF single crystals was higher than that of purer (< 10 ppm Mg) ones, probably because of the interactions of edge dislocations with tetragonal lattice brought into coincidence, so that the maps shown here can be treated as broadly typical of all alkali halides. This scaling of mechanical properties is discussed further in Chapter 18. distortions produced by Mg2+ –vacancy pairs. The hardness also varies with impurity concentration (Chin et al., 1972 [7] and Suszynska, 1971 [8]), but slowly; so at low impurity levels the yield stress is almost independent of the impurity concentration.
For all these reasons, there is a great deal of scatter in published data for alkali halides. We have fitted the equations to the available data, giving most weight to data from pure polycrystalline specimens.
We have calculated the shear modulus and its temperature dependence from:
|
|
using the single-crystal constants of the Landolt-Bornstein Tables (1966 [9] and 1969 [10]).
A recent study of the microhardness of nine alkali halides (Brown and Ashby, 1981) [11] has shown that, when plotted on the normalized axes σs/μ and T/TM, the mechanical strengths of all nine are brought into coincidence, so that the maps shown here can be treated as broadly typical of all alkali halides. This scaling of mechanical properties is discussed further in Chapter 18.
Figs. 10.1 and 10.2 show maps for NaCl with a grain size of 50 µm. They are based on data plotted on the figures, and summarized in Table 10.1.
The crystallographic, thermal and elastic data are from standard sources, listed on Table 10.1. Diffusion measurements show much scatter; in making the maps, it is best to replot the available data (rejecting any that is suspect because of dubious purity or poor technique), and then to choose diffusion constants that best fit all the data, as shown in Fig. 10.5. The anion diffuses more slowly than the cation at all temperatures. It is the anion diffusion data that appears in Table 10.1.
The scope of the data for glide and creep is shown in Fig. 10.1. The data are confused, and our choice of parameters requires explanation.
Burke (1968) [12] compressed polycrystalline NaCl to steady state in the power-law creep regime, between 330°C and 740°C. Above 530°C, he found an activation energy off 205 ± 25 kJ/mole, close to that for lattice diffusion of chlorine, the slower diffusing species in NaCl. Below 530°C he observed a drop in activation energy to 155 ± 25 kJ/mole—which matches inferred data on core diffusion (Barr et al., 1960) [13] —and an increase in the stress exponent n by about 2. This, we think, reflects the influence of impurities on the isoelectric temperatures (and thus on core diffusion) discussed in Section 10.1. On this assumption we have fitted Burke's data to eqn. (2.21), using an effective diffusion coefficient (eqn. (2.20)) which includes the core-diffusion controlled term: the resulting parameters are listed in Table 10.1.
There is some additional information for NaCl. Poirier (1972) [14] compressed pure single crystals in the higher temperature range from 750 to 795°C. Though his measurements of the activation energy for creep disagree with those of Burke, a corrected analysis by Rothman et al. (1972) [15] support Burke's results. Further data exist in the core-diffusion controlled creep regime. Heard (1972) [16], using comparatively impure Baker reagent grade salt (including about 40 ppm H2O), extended polycrystalline specimens under a confining pressure of 2 kbar. The observed shear strain rates (3.2 x 10⁻¹ to 2 x 10⁻⁸/s between the temperatures 23°C and 400°C) were 102 to 104 times faster than indicated on the maps. The activation energy measured was only 99.5 kJ/mole (cf. 155 kJ/mole used in the lowtemperature creep regime). The increased strainrates and altered activation energy may be caused by the presence of water: Benard and Cabane, 1967 [17], for example, report enhanced boundary diffusion in the presence of water. Some of this additional information is plotted on the figures, but was ignored in deriving the parameters of Table 10.1.
Kingery and Montrone (1965) [18] measured diffusional flow in polycrystalline NaCl at 740°C. Their material was relatively impure analytical reagent-grade NaCl, also containing 1 µm particles of alumina and about 4% porosity. The data are included in Fig. 10.1.The parameters describing glide (Table 10.1) are based on microhardness measurements (Verrall et al., 1977 [19], and Ashby and Brown, 1981[20]).
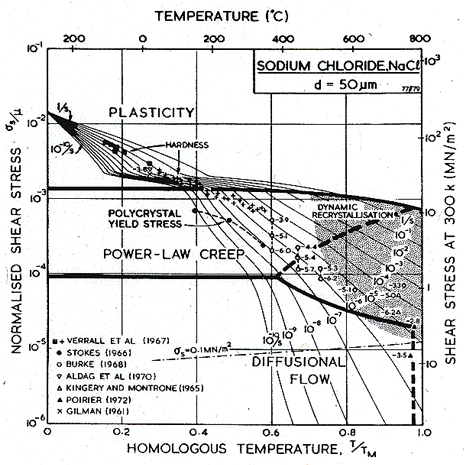
Fig.10.1. A
stress/temperature map for NaCl of grain size 50
µm. Data are labelled with log10(![]() )
)
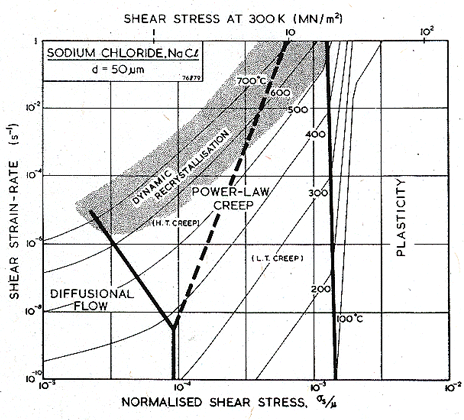
Fig.10.2. A strain-rate/stress map for NaCl of grain size 50 µm.
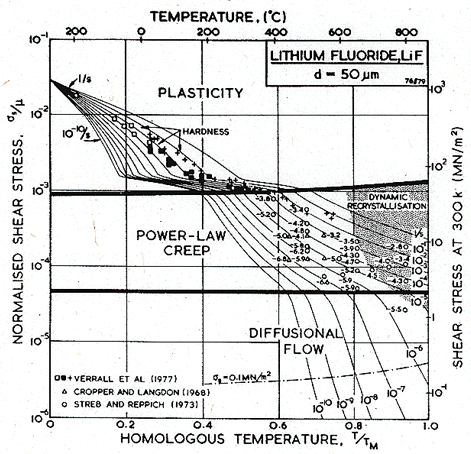
Fig.10.3. A
stress/temperature map for LiF of grain size 50
µm. Data are labelled with log10(![]() )
)
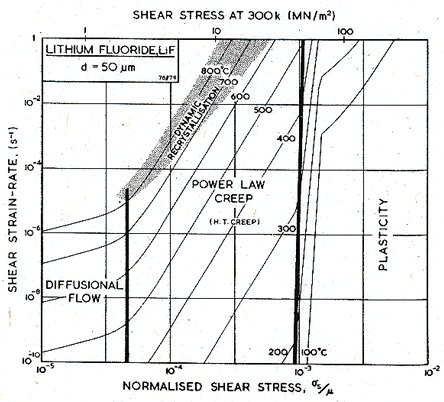
Fig. 10.4. A strain-rate/stress map for LiF of grain size 50 µm.
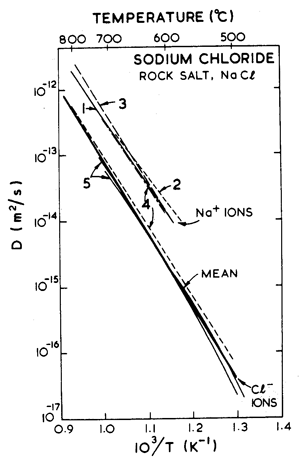
Fig.10.5. Anion and cation diffusion in-NaCl. The data are from: (l) Rothman et al. (1972) [15]; (2) Downing and Friauf (1970) [21]; (3) Nelson and Friauf (1970) [22]; (4) Beniere et al. (1970) [23]; (5) Barr et al. (1965) [24].
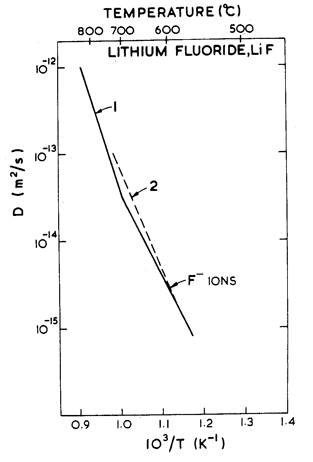
Fig. 10.6. Anion diffusion in LiF. The data are from: (I) Matzke (1971) [25]; (2) Eisenstadt (1963) .
Figs. 10.3 and 10.4 show maps for LiF with a grain size of 50 µm. They are based on data plotted on the figures, and summarized in Table 10.1. The crystallographic, thermal and elastic data are from standard sources listed on Table 10.1.
Cropper and Langdon (1968) [26] observed powerlaw creep in polycrystalline LiF between 450°C and 550°C, tested in compression. Their data appear to be the most reliable, and the parameters of Table 10.1, and the maps, are based on it. A substantial body of single-crystal data is available (Streb and Reppich, 1972) [27]. It is shown in the data plots of Fig. 10.3; it is not corrected in any way to make it comparable with the polycrystal data, nor was it used in the construction of the maps.
Data for lattice diffusion of the anion F- are shown in Fig. 10.6. Neither dislocation-enhanced nor grain boundary-enhanced diffusion have been observed in lithium fluoride. Impurity effects (discussed in Section 10.1) may provide an explanation for this difference with sodium chloride. As a result, however, no low temperature power-law creep regime or Coble-creep regime appear in the maps for lithium fluoride.
The glide parameters (Table 10.1) are based on microhardness measurements of Verrall et al. (1977) [19] and Ashby and Brown (1981) [20].
1. Gutmanas, E.Y. and E.M. Nadgornyi, Phys. Stat. Sol., 1970. 38: p. 777.
2. Carter, N.L. and H.C. Heard, Am. J. Sci., 1970. 269: p. 193.
3. Greenwood, N.N., Ionic Crystals, Lattice Defects and Non-Stoichiometry. 1970, London: Butterworths.
4. Kliewer, K. and J. Koehler, Phys. Rev., 1965. A140: p. 1226.
5. Johnston, W.G., Journal of Applied Physics, 1962. 33: p. 2050.
6. Guiu, F. and T.G. Langdon, Philosophical Magazine( before 1978), 1974. 24: p. 145.
7. Chin, G.Y., et al., Scripta Metallurgica (before 1990), 1972. 6: p. 475.
8. Suszynska, M., Phys. Stat. Sol., 1971. (a)(6): p. 79.
9. Landolt-Bornstein Tables, 3-1. 1966, Springer-Verlag: Berlin.
10. Landolt-Bornstein Tables,3-2. 1969, Springer-Verlag,: Berlin.
11. Brown, A.M. and M.F. Ashby. Deformation of Polycrystals: Mechanisms and Microstructures. in Second RisØ Int. Symp. 1981. RisØ Nat. Lab., Denmark.
12. Burke, P.M. 1968, Stanford University, Dept. of Engineering and Metallurgy.
13. Barr, L.W., et al., Trans. Faraday Soc., 1960. 56: p. 697.
14. Poirier, J.P., Phil. Mag., 1972. 26: p. 701.
15. Rothman, S.J., et al., J. Phys. Chem. Solids, 1972. 33: p. 1061.
16. Heard, H.C., The Griggs Volume. 1972, American Geophysical Union Monograph.
17. Benard, J. and J. Cabane, Sintering, K.G. C, Editor. 1967, Gordon & Breach.
18. Kingery, W.D. and E.S. Montrone, Journal of Applied Physics, 1965.
19. Verrall, R.A., R.J. Fields, and M.F. Ashby, Journal of American Ceramic Society, 1977. 60: p. 211.
20. Ashby, M.F. and A.M. Brown. in Proc. 2nd RisØ Int. Symp. on the Deformation of Polycrystals. 1981.
21. Downing, H.L. and R.J. Friauf, Journal of the Physics and Chemistry of Solids, 1970. 31: p. 845.
22. Nelson, V.C. and R.J. Friauf, J. Phys. Chem. Solids, 1970. 31: p. 825.
23. Bèniere, F., B. M., and M. Chemla, Bèniere, F. Bèniere M. Chemla, M. J. Phys. Chem. Solids, 1970. 31: p. 1205.
24. Barr, L.W., J.A. Morrison, and P.A. Schroeder, Journal of Applied Physics, 1965. 36: p. 624.
25. Matzke, H., J. Phys. Chem. Solids, 1971. 32: p. 437.
26. Cropper, D.R. and T.G. Langdon, Philosophical Magazine( before 1978), 1968. 18: p. 1181.
27. Streb, G. and B. Reppich, Phys. Stat. Sol., 1972. (a)(16): p. 493.
