PURE IRON AND FERROUS ALLOYS
8.1 General Features of the Mechanical Behaviour of Iron and Ferrous Alloys
8.2 Origins of the Data for Pure Iron and Ferrous Alloys
THIS chapter describes maps for pure iron, a low-alloy ferritic steel, and two stainless steels. Because it is the basis of all ferrous alloys, pure iron is treated in more detail than any other material in this book. Its behaviour is complicated by two crystallographic and one magnetic phase change, but a vast body of data exists, adequately covering the temperature range from 0.05 TM to 0.9 TM. This allows the construction of a map (Fig. 8.1) which, although complicated, gives a reasonably accurate and complete summary of its mechanical behaviour.
The steels are treated at a less detailed level. It is impractical here to try to analyse a wide range of steels; not only are there a large number of them, but, when strength is derived from thermomechanical processing, one map properly describes only one state of heat treatment and mechanical history. Rather our aim is to illustrate the broad features that characterize two important classes of steels which are used at both low and high temperatures (a ferritic 1% Cr-Mo-V steel, and types 316 and 304 stainless steels). Many of these features are common to a range of similar steels—and the illustration of the method and results may help the reader who wishes to characterize a steel of particular interest to himself.
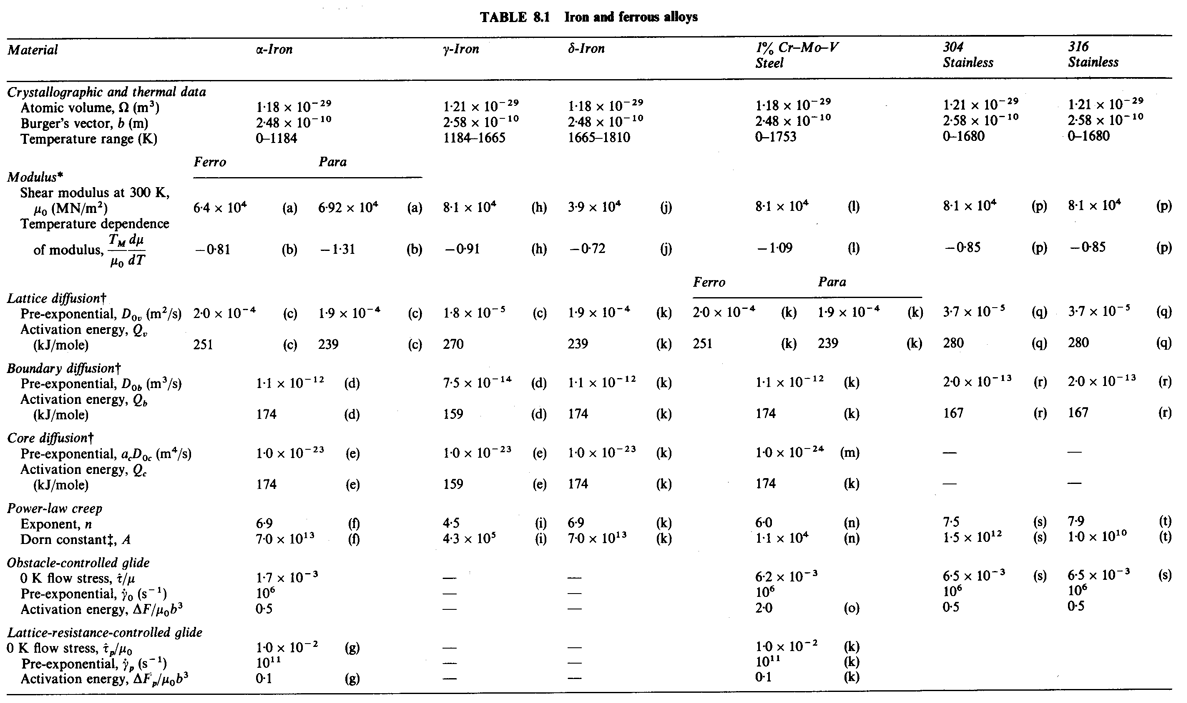
The low-alloy ferritic steels are used for applications where a high strength at or above room temperature is required. They are widely used for steam pipes and turbine casings, where they are required to carry load at temperatures up to 550°C. The stainless steels are used over an even wider temperature range—from 4.2 K (in cryogenic equipment) to over 650°C (in chemical engineering applications, and in nuclear power plant). The particular steels analysed here are typical of their class, after a typical thermomechanical treatment. The maps for them are based on data presented below, and on the parameters listed in Table 8.1.
 |
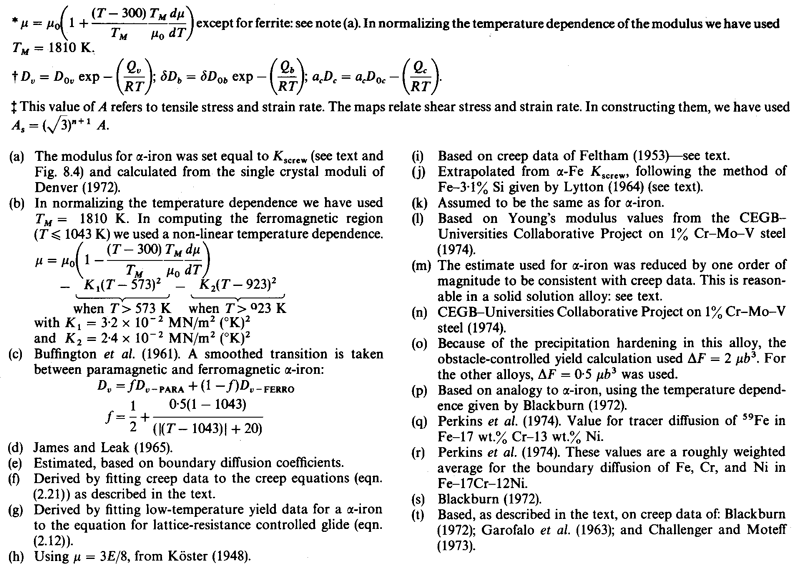 |
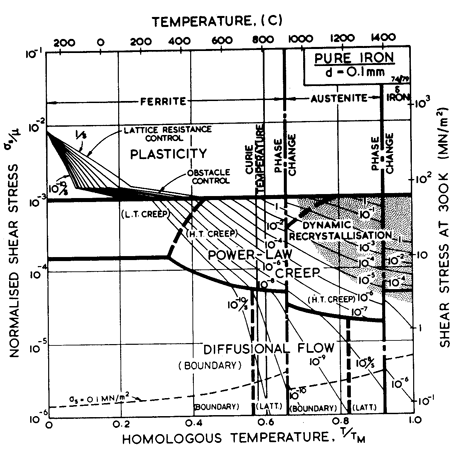
Fig. 8.1. Pure iron of grain size 100 µm.
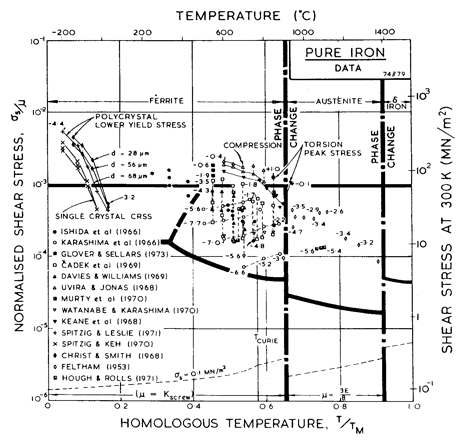
Fig. 8.2. Data for pure iron,
divided into blocks and labelled with log10 (![]() )
)
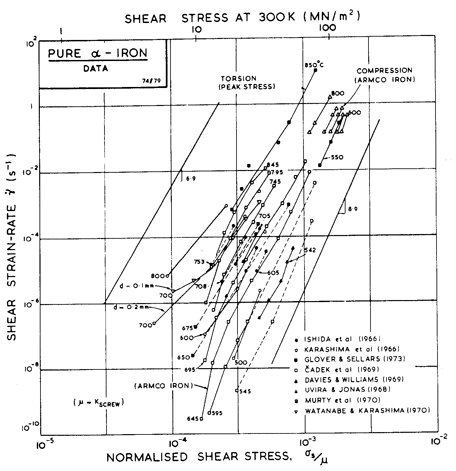
Fig. 8.3. Creep data for pure α-iron, and labelled with the temperature in °C.
|
8.1 GENERAL FEATURES OF THE MECHANICAL BEHAVIOUR OF IRON AND FERROUS ALLOYS |
The map for pure iron (Fig. 8.1) is based on data shown in Figs. 8.2 to 8.6 (Frost and Ashby, 1977) [1]. It is complicated by two crystallographic and one magnetic phase change. It shows three sections corresponding to the three allotropic forms of iron: α, γ and δ. At each crystallographic phase change the strength has a sharp discontinuity, and at the magnetic phase change its derivative with respect to temperature changes—largely because of similar changes in the moduli and the diffusion coefficients. But although it is complicated in this way, the data for iron are extensive, and the map is a good fit to a large body of mechanical measurements.
The α-region of the map shows a field of dislocation-glide in much of which a lattice resistance limits the strain-rate; a power-law creep field, with core-diffusion important at the low temperature end; and a field of diffusional flow, with boundary diffusion important at the low temperature end.
The creep fields are truncated at 910°C by the phase-change to austenite, where the field boundaries and the strain-rate contours suffer a sharp discontinuity. This is because all the physical properties (lattice parameter, Burger's vector, modulus, diffusion coefficients, etc.) change sharply here, and again at the γ-δ phase transformation at 1381°C; the most important change is that of a factor of about 100 in the lattice diffusion coefficient.
Austenite shows a field of power-law creep, and a subdivided diffusional-flow field (for the grain size used here: 0.1 mm). The regime of δ-iron shows one of each, neither subdivided. Flow in iron is further complicated by the loss of ferromagnetism at the Curie temperature: 770°C. This temperature is marked on the map; its effects are discussed in Section 8.2.
The problem of properties which depend on the thermomechanical treatment becomes important with the creep resistant low-alloys ferritic steels such as the 1% Cr-Mo-V steel described by Fig. 8.7. These alloys derive most of their strength from precipitation-hardening; small changes in thermomechanical history have large effects on the mechanical behaviour; and over-ageing in service is an important consideration (Honeycombe, 1980) [2]. It would be useful to know how the field boundaries of the maps move during ageing, but at present there is insufficient experimental data to do more than guess at this. In practice, however, the steel is used in one of a few standard states and is limited in its use to temperatures below 600°C because of oxidation. Ageing in service becomes important only above 550°C, so the map has some general usefulness below this temperature.
The alloy starts to transform to austenite at about 700°C, and is never used structurally above this temperature, where its strength would be little better than that of pure austenite. For completeness we have shown the contours and field boundaries for pure austenite (though this ignores the small solution-hardening effect that the alloying elements would exert in the γ-phase). It emphasizes the high flow stress and creep resistance of the dispersion-strengthened ferrite. The alloying suppresses the b.c.c. δ-phase, which therefore does not appear on the map.
The map is a tolerable fit to the available data (which are plotted on it), and is drawn for a grain size close to that of the alloys from which the data came. It shows that the diffusional-flow field lies just below the area covered by the data (one point may lie in this field), and suggests that diffusional flow could become the dominant mechanism in applications of the alloy at above 450°C if the precipitates do not inhibit the grain boundary acting as sinks and sources for diffusion (Chapter 17, Section 17.3).
In some ways the f.c.c. stainless steels (Figs. 8.8 to 8.13) are simpler than the ferritic steels (Parr and Hanson, 1965) [3]. Both 304 and 316 stainless derive a large part of their strength from solid-solution hardening, a mechanism which is largely unaffected by thermal or mechanical processing. But, particularly in 316, part of the strength is due to a precipitate of carbides. Its contribution, too, depends on the previous history of the steel, and may change during the service life. For that reason, a map for 316 stainless describes the steel in one structural state only: bar-stock in the as-received condition, in the case of the maps shown here. Strictly, a new map should be constructed for each condition of the steel, though in practice the changes may be slight, and the map shown below gives at least an approximate picture of its mechanical behaviour.
An alternative form of map is shown in Figs. 8.10 and 8.13: one with axes of strain-rate and stress—a more conventional way of presenting creep data. The data themselves are shown in these figures (which have been constructed for a grain size of 100 µm, close to that of the specimens from which the data were obtained). These plots give a good way of checking the position of field boundaries against experiments: both show evidence for a transition to diffusional flow at low stresses and for power-law breakdown at high.
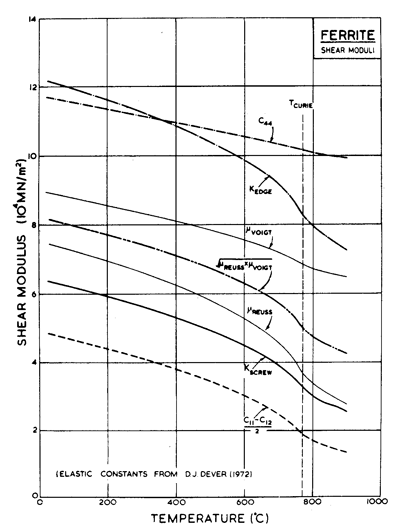
Fig. 8.4. Shear moduli for α-iron.
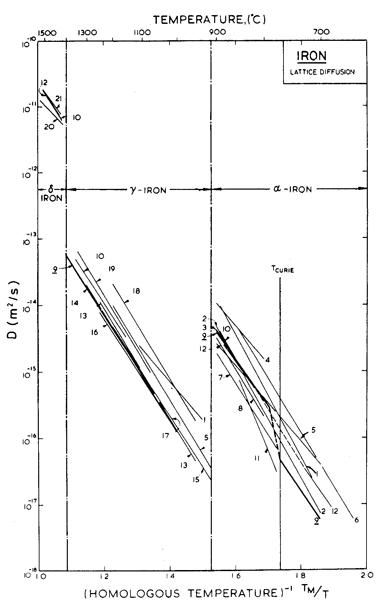
Fig.8.5. Lattice diffusion data for iron. The data are from: (1) Birchenall and Mehl (1948) [4]; (2) Birchenall and Mehl (1950) [5]; (3) Buffington et al. (1951) [6]; (4) Gruzin (1952); (5) Zhukhovitskii and Geodakyan (1955) [7]; (6) Golikov and Borisov (1955) [8]; (7) Leymonie and Lacombe (1957, 1958, 1959, 1960) [9-12]; (8) Borg and Birchenall (1960) [13]; (9) Buffington et al. (1961) [14]; (10) Graham and Tomlin (1963) [15]; (11) Amonenko et al (1966) [16]; (12) James and Leak (1966) [17]; (13) Gruzin (1953) [18]; (14) Mead and Birchenall (1956) [19]; (15) Bokshtein et al. (1957) [20]; (16) Gertsriken and Pryanishnikov (1958) [21]; (17) Bokshtein et al. (1959) [22]; (18) Bogdanov (1962) [23]; (19) Sparke et al. (1965) [24]; (20) Staffansson and Birchenall (1961) [25]; and (21) Borg et al. (1963) [26].
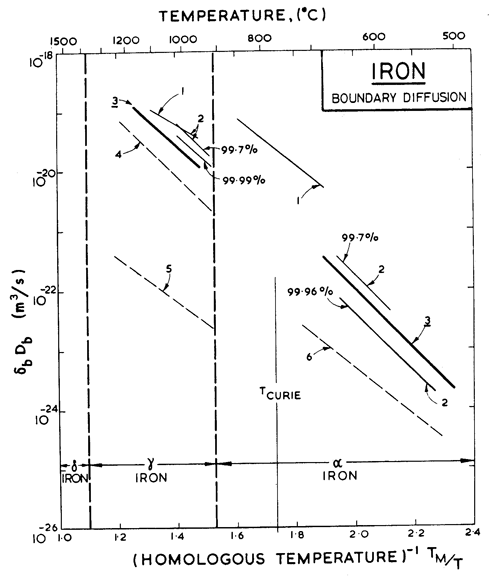
Fig. 8.6. Grain boundary diffusion of iron. The data are from: (1) Borisov et al. (1964) [27]; (2) Guiraldeng and Lacombe (1965) [28]; (3) James and Leak (1965) [29]; (4) Lacombe et al. (1963) [30]; (5) Bokshtein et al. (1959) [22]; and (6) Gertsriken and Pryanishnikov (1959) [31].
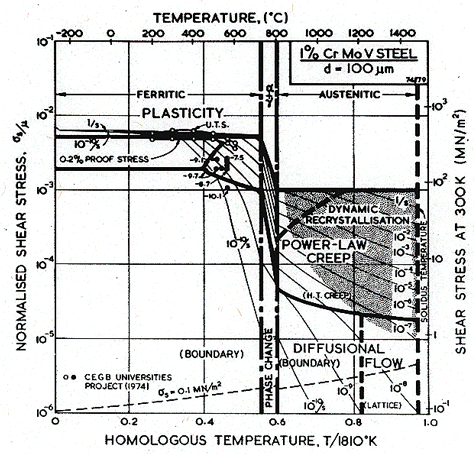
Fig. 8.7. A 1% Cr-Mo-V steel, of grain size 100 µm, showing data.

Fig. 8.8. A stress/temperature map for type 316 stainless steel of grain size 50 µm.
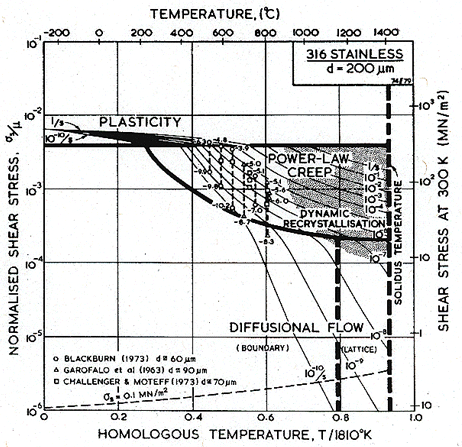
Fig. 8.9. A stress/temperature map for type 316 stainless steel of grain size 200 µm, showing data.
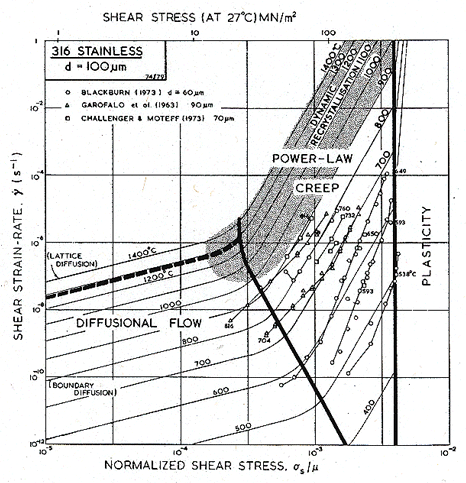
Fig. 8.10. A strain-rate/stress map for type 316 stainless steel of grain size 100 µm, showing data.
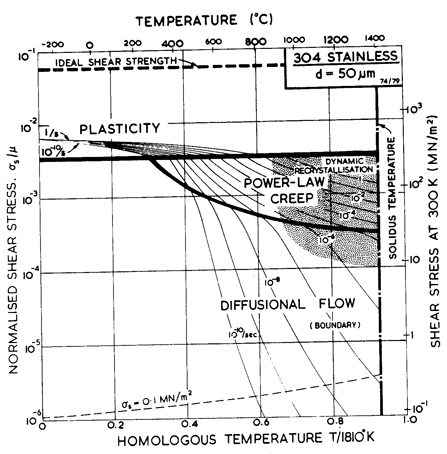
Fig.8.11. A stress/temperature map for type 304 stainless steel of grain size 50 µm.
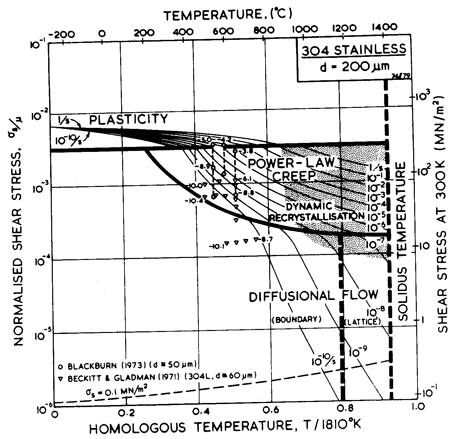
Fig.8.12. A stress/temperature map for type 304 stainless steel of grain size 200 µm, showing data.
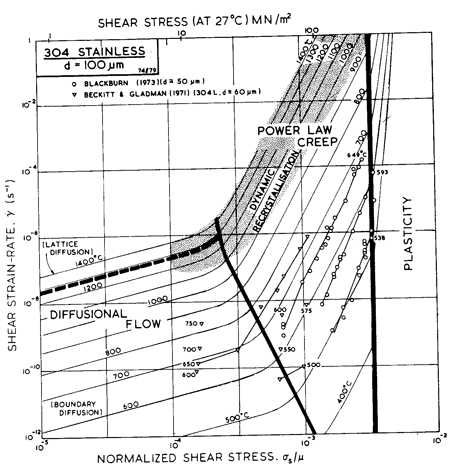
Fig. 8.13. A strain-rate/temperature map for type 304 stainless steel of grain size 100 µm, showing data.
8.2 ORIGINS OF THE DATA FOR PURE IRON AND FERROUS ALLOYS
Fig. 8.1 shows a map for pure iron with a grain size of 100 µm. It is based on data plotted in Figs. 8.2 to 8.6, and summarized in Table 8.1.
The crystallographic data (Burger's vector, b; atomic volume, Ω) for α-and γ-iron are from Taylor and Kagle (1963) [32]. Those for δ were extrapolated from data for α.
The modulus at 300 K
and its temperature dependence present special problems for
α-iron. Single crystals are
elastically anisotropic, so the appropriate average of the single-crystal moduli must first be chosen. Fig. 8.4 shows various possible choices. The
moduli c44 and ![]() (c11 —c12),
the extremes of the single-crystal shear moduli, were calculated from the
measurements of Dever (1972) [33]. The Voigt and Reuss averages, though closer together, still differ considerably. The figure also shows the functions of the single-crystal moduli appropriate for the calculation of the energy of a <111> edge (Kedge) and <111> screw (Kscrew) dislocation in
α-iron on a (110) plane, using the
results of Hirth and Lothe (1968) [34]. In what follows, we have used Kscrew.
(c11 —c12),
the extremes of the single-crystal shear moduli, were calculated from the
measurements of Dever (1972) [33]. The Voigt and Reuss averages, though closer together, still differ considerably. The figure also shows the functions of the single-crystal moduli appropriate for the calculation of the energy of a <111> edge (Kedge) and <111> screw (Kscrew) dislocation in
α-iron on a (110) plane, using the
results of Hirth and Lothe (1968) [34]. In what follows, we have used Kscrew.
This figure illustrates the second problem with α-iron. Because of the magnetic transformation at 770°C, the modulus changes with temperature in a non-linear way (it also influences the diffusion coefficients—see below). Instead of the linear temperature correction to μ0, which is usually adequate, we have here used a power-law for μ, giving a close approximation to the variation of Kscrew with temperature (see Table 8.1, note b). Because the map is plotted on normalized axes, the anomalous behaviour of Kscrew is not apparent. It becomes so when the true stress is plotted: see the line labelled σs = 0.1 MN/m2 on Fig. 8.1.
The modulus of γ-iron, and its temperature dependence, are poorly characterized. We calculated both from Koster's (1948) [35] measurements of Young's modulus, E, by setting , μ = 3E/8. The modulus of δ-iron, too, presents a problem. A linear extrapolation from paramagnetic α-iron goes to zero at a temperature below the melting point. We have therefore extrapolated the polycrystalline modulus of Fe-3.1% Si (as proposed by Lytton, 1964 [36]) and corrected this to give a screw-dislocation modulus by multiplying it by the ratio of Kscrew (α-iron, 912°C) to μ (Fe-3.1% Si, 912°C).
Like the moduli, the diffusion coefficients for iron present special problems. Data for lattice diffusion are shown in Fig. 8.5 which illustrates the large, sharp decrease in Dυ when ferrite transforms to austenite, and the similar increase when this reverts to δ-iron. A subtler influence is that of the magnetic transformation: diffusion in ferrite does not follow an Arrhenius law, but is about 3 times larger at 770°C than one would expect by extrapolation from lower temperatures (and thus has a temperature dependent activation energy: Buffington et al., 1961 [14]; Kucera et al., 1974 [37]). We have used the lattice diffusion coefficients of Buffington et al. (1961) [14] labelled 9 on Fig. 8.3, for both α-and γ-iron, and have assumed, as Fig. 8.5 suggests, that the coefficients for δ-iron are the same as those for α-iron.
The discontinuity in boundary diffusion rates (Fig. 8.6) at the phase boundaries is nothing like as large as that for lattice diffusion, presumably because the change in grain-boundary structure is not as profound as the change from a non-close-packed to a close-packed arrangement of atoms that occurs within the grains. We used the coefficients of James and Leak (1965) [29], labelled 3 on Fig. 8.6, which lie broadly through the available data. The core diffusion parameters, too, are based on their measurements.
The power-law creep parameters for α-iron (n and A) and information about core diffusion (acDc) were obtained by fitting the power-law creep equation to the data plotted in Figs. 8.2 and 8.3. For high-temperature creep we have used the value n = 6.9 of Ishida et al. (1966) [38], which describes all the data reasonably well (Fig. 8.3). Except near the Curie temperature, the activation energy for high-temperature creep is close enough to that for lattice diffusion for the two to be equated; the anomaly is properly incorporated into the map through the non-linear temperature-dependence of the modulus and the diffusion anomaly described above.
Although there is little evidence for a low-temperature creep field for ferrite, experience in constructing maps for other b.c.c. metals (Chapter 5) indicates that it is usually present. The core diffusion coefficients are based on the grain boundary data for ferrite (James and Leak, 1965 [29]). Using these gives the small field shown in Fig. 8.1, and puts almost all the data of Fig. 8.3 into the high-temperature creep field—a result which is consistent with the data.
There are fewer data for creep of γ-iron than for α-iron (Fig. 8.2). The bulk of the data is due to Feltham (1953) [39] whose data we have used to derive the creep parameters n and A. In using the map of Fig. 8.1 it should be remembered that the stress is normalized with respect to a different modulus above and below the transformation temperature:
|
μ(α -Fe, 912°C) = 2.5 x 10⁴ MN/m2 |
|
|
μ(γ -Fe, 912°C) = 4.5 x 10⁴ MN/m2 |
This normalization conceals the
true magnitude of the discontinuity of strain-rate at 912°C: it is larger
than it appears from Fig. 8.1. The difference in normalizations is shown by the
dashed line of constant shear stress
σs
= 0.1 MN/m2. The strain-rate contours should be displaced
accordingly to give the discontinuity in ![]() at constant
σs.
at constant
σs.
The creep parameters of δ-iron were set equal to those for α-iron. We suspect that n = 6.9 may be a little high, but having no data to guide us, we have used it.
The glide parameters for α-iron were determined by fitting the equations for lattice-resistance and obstacle-controlled glide (eqns. 2.12 and 2.9) to the data shown in Fig. 8.2.
Pure iron shows dynamic recrystallization above 0.7 TM (1000°C). The positioning of the shaded field is based on data of Wray (1975 a, b; 1976) [40-42] and Wray and Holmes (1975) [43].
The map shown in Fig. 8.7 describes a particular batch of 1% Cr-Mo-V steel (CEGB-Universities Collaborative Project, 1974 [44]). Its composition is given in Table 8.2. All tests were carried out on forged material after a standard heat treatment designed to give a fine-grained, tempered bainite containing a carbide dispersion. (The heat-treatment was as follows: soak at 1000°C; furnace cool to 690°C and hold for 70 hours; air cool; reheat and soak in salt bath at 975°C; quench into a second salt bath at 450°C; air cool; reheat to 700 ± 3°C for 20 hours.)
TABLE 8.2 Composition of the steel, wt. %
|
C |
Si |
Mn |
Ni |
Cr |
Mo |
V |
S |
P |
Fe |
|
0.24 |
0.29 |
0.64 |
0.21 |
1.02 |
0.57 |
0.29 |
0.10 |
0.16 |
bal |
The modulus μ0 and its temperature were calculated from data for Young's modulus for the polycrystalline alloy (CEGB-Universities Project, 1974 [44]) taking μ0 ≈ ⅜E0. The elaborate treatment used to describe the modulus of pure ferrite is unnecessary here: the Curie temperature, and the elastic anomalies associated with it, lie above the α-γ phase transition.
The lattice and boundary diffusion coefficients are those for pure ferrite. Though the alloying elements will change the diffusion coefficient for steady-state mass transport (Chapter 2, Section 2.4) the effect is slight in a low-alloy steel, and can be ignored.
The data for dislocation glide obtained by the CEGB-Universities Project are well described by eqn. (2.9) with a large value of ∆F= 2μb3. This implies strong obstacles (presumably the carbides) and a flow stress which, when normalized, is insensitive to temperature or strain-rate (it is probably the Orowan stress for the carbide dispersion; see Chapter 2, Table 2.1).
The data for power-law creep are barely adequate for the construction of a map; they are derived from constant stress data for "Piece 2" of the CEGB Universities Project (1974) [44]. "Piece 4" crept onethird as fast, emphasizing that heat-treatable alloys such as this one are sensitive to slight variations in composition or heat treatment.
The observed activation energy for creep (250-370 kJ/mole) lies close to that for self-diffusion. The observations suggest that core-diffusion is suppressed in this alloy (see also Chapter 7). We have suppressed it by reducing the pre-exponential by a factor of 10: all the data then lie in the high-temperature creep field.
There is no experimental verification of diffusional flow in this alloy. The simple treatment of Chapter 2 (eqn. 2.29)), on which the map is based, suggests that Coble-creep could become the dominant deformation mode at low strain rates above 450°C. But a fine dispersion may suppress diffusional flow (Chapter 17, Section 17.3). This field may, therefore, lie lower than we have shown it; only further experiments at low stresses can resolve this point.
Maps and data for 316 and 304 stainless steels are shown in Figs. 8.8 to 8.13. They are based on data which are plotted on the maps themselves, and on the parameters listed in Table 8.1. The specifications of the two alloys allows a certain latitude of composition. The maps are based on published data derived from three batches of 316 and two of 304; these compositions are listed in Table 8.3. (Both alloys are also available in a low-carbon specification designated 316L and 304L, with less than 0.03% carbon. Their properties differ significantly from those described by the maps shown here.)
The modulus and its temperature dependence are from Blackburn (1972) [45]. The diffusion coefficients of the components in these alloys are well documented. Perkins et al. (1973) [46] list both lattice and boundary diffusion data for Fe, Cr and Ni in an alloy with a composition close to that of the two steels. Strictly, the proper diffusion coefficient for steady-state transport is one based on eqn. (2.27). While Perkins' data are sufficiently complete to allow this to be calculated, the three major components in the steel diffuse at so nearly equal rates that it is simplest to take the coefficient for the principal component, iron; this choice gives an adequate description of the creep data described below.
Boundary diffusion, too, should properly be described by a combination of diffusion coefficients. Again, we have taken a single coefficient (167 kJ/mole amongst the quoted values of 150.7 ± 9.6 for Cr, 177 ± 17.2 for Fe and 133.9 ± 8.0 for Ni), and a pre-exponential that places the coefficient in the centre of the scattered data.
The power-law creep parameters were derived from the blocks of data shown in Figs. 8.10 and 8.13. A simple power-law does not describe the data very well: much of it was obtained at high stresses, where the power-law starts to break down. For 316 (Fig. 8.10) we used a value n = 7.0, which lies between that for the high-temperature, low-stress data of Garofalo et al. (1963) [47] and the low-temperature, high-stress data of Blackburn (1972) [45]: over the range they investigated, n varies from 4 to 10. Garofalo himself fits his data to a (sinh β'σs)n' law (eqn. 2.25), which is more flexible than a power-law but less satisfactory than eqn. (2.26), for reasons explained in Chapter 2, Section 2.4. Further, an activation energy for creep, derived by appropriately replotting the data of Fig. 8.10, is rather higher than that for diffusion. The pre-exponential constant, A, is chosen to match the data of Garofalo et al. at 732°C, and that of Blackburn at 650°C, but because of the discrepancy between the activation energies for creep and for diffusion, and the indifferent fit of the data to a power-law, this creep field must be regarded as a first approximation only.